TomTom 2012 Annual Report Download - page 62
Download and view the complete annual report
Please find page 62 of the 2012 TomTom annual report below. You can navigate through the pages in the report by either clicking on the pages listed below, or by using the keyword search tool below to find specific information within the annual report.-
 1
1 -
2
-
3
-
4
-
5
-
6
-
7
-
8
-
9
-
10
-
11
-
12
-
13
-
14
-
15
-
16
-
17
-
18
-
19
-
20
-
21
-
22
-
23
-
24
-
25
-
26
-
27
-
28
-
29
-
30
-
31
-
32
-
33
-
34
-
35
-
36
-
37
-
38
-
39
-
40
-
41
-
42
-
43
-
44
-
45
-
46
-
47
-
48
-
49
-
50
-
51
-
 52
52 -
 53
53 -
 54
54 -
 55
55 -
 56
56 -
 57
57 -
 58
58 -
 59
59 -
 60
60 -
 61
61 -
 62
62 -
 63
63 -
 64
64 -
 65
65 -
 66
66 -
 67
67 -
 68
68 -
 69
69 -
 70
70 -
 71
71 -
 72
72 -
73
-
74
-
75
-
76
-
77
-
78
-
79
-
80
-
81
-
82
-
83
-
84
 |
 |

TomTom Annual Report and Accounts 2012
60
Notes to the Consolidated Financial Statements | continued
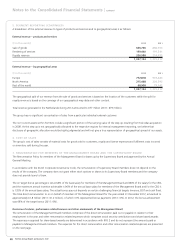
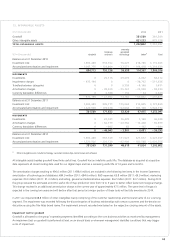
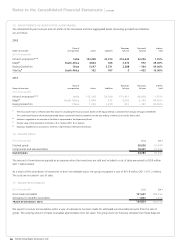
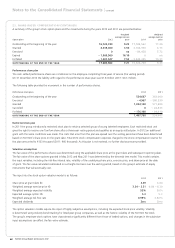
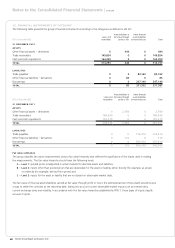
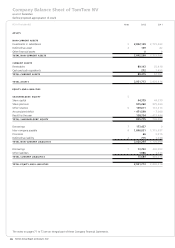
19. OTHER FINANCIAL ASSETS
Other fi nancial assets include derivative fi nancial instruments carried at fair value through profi t or loss.
(€ in thousands) 2012 2011
Assets Liabilities Assets Liabilities
Derivatives at fair value through profi t or loss 444 – 85 2,784 – 116
Derivatives at fair value through profi t or loss
The notional principal amounts of the outstanding forward foreign exchange and option contracts at 31 December 2012 were €62 million
(2011: €64 million).
All our outstanding options and forwards have a contractual maturity of less than one year.
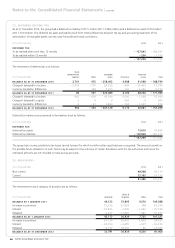
20. CASH AND CASH EQUIVALENTS
(€ in thousands) 2012 2011
Cash at banks 140,205 192,861
Deposits 24,254 718
164,459 193,579
Cash and cash equivalents consist of cash held by the group partly invested in short-term bank deposits with an original maturity of three
months or less. The carrying amount of cash and cash equivalents approximates its fair value.
All cash and cash equivalents are available for immediate use by the group.
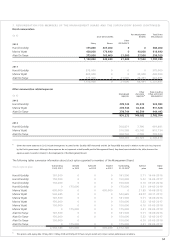
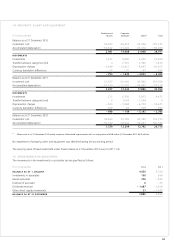
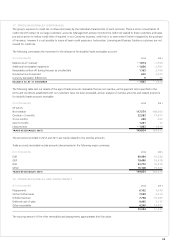
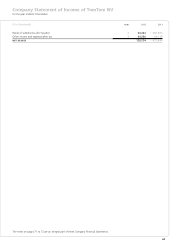
21. SHAREHOLDERS’ EQUITY
2012 2011
Number (€ in thousands) Number (€ in thousands)
AUTHORISED
Ordinary shares 600,000,000 120,000 600,000,000 120,000
Preferred shares 300,000,000 60,000 300,000,000 60,000
900,000,000 180,000 900,000,000 180,000
ISSUED AND FULLY PAID
Ordinary shares 221,895,012 44,379 221,895,012 44,379
All shares have a par value of €0.20 per share (2011: €0.20 per share). Further information on the rights, restrictions and other conditions
attached to ordinary and preferred shares is provided in the Corporate Governance section in the Annual Report.
In 2012, no shares were issued following the exercise of stock options by employees (2011: 86,927).
Our reserves are freely distributable except for €110.0 million of legal reserves (2011: €70.1 million) Note 6 in our company fi nancial
statements provides an overview of our non-distributable reserves.
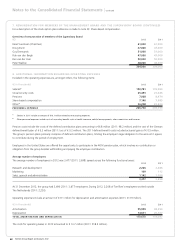
Protection mechanism
The Corporate Governance section of this Annual Report provides a detailed description regarding the use of Stichting Continuiteit TomTom
as a protection measure against hostile takeovers.
Management is of the opinion that the call option does not represent a signifi cant value as meant in IAS 1, paragraph 31 due to the fact
that the likelihood that the call option will be exercised is remote. In the remote event that the call option is exercised, the B preferred
shares which are issued are intended to be cancelled shortly after issuance. The option is therefore not accounted for in the annual
accounts nor is any additional information as meant in IAS 32 and 39 provided.