TomTom 2012 Annual Report Download - page 10
Download and view the complete annual report
Please find page 10 of the 2012 TomTom annual report below. You can navigate through the pages in the report by either clicking on the pages listed below, or by using the keyword search tool below to find specific information within the annual report.-
 1
1 -
 2
2 -
 3
3 -
 4
4 -
 5
5 -
 6
6 -
 7
7 -
 8
8 -
 9
9 -
 10
10 -
 11
11 -
 12
12 -
 13
13 -
 14
14 -
 15
15 -
 16
16 -
 17
17 -
 18
18 -
 19
19 -
 20
20 -
 21
21 -
22
-
23
-
24
-
25
-
26
-
27
-
28
-
29
-
30
-
31
-
32
-
33
-
34
-
35
-
36
-
37
-
38
-
39
-
40
-
41
-
42
-
43
-
44
-
45
-
46
-
47
-
48
-
49
-
50
-
51
-
52
-
53
-
54
-
55
-
56
-
57
-
58
-
59
-
60
-
61
-
62
-
63
-
64
-
65
-
66
-
67
-
68
-
69
-
70
-
71
-
72
-
73
-
74
-
75
-
76
-
77
-
78
-
79
-
80
-
81
-
82
-
83
-
84
 |
 |
TomTom Annual Report and Accounts 2012
8
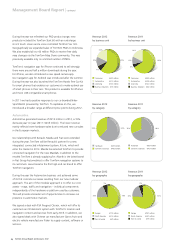
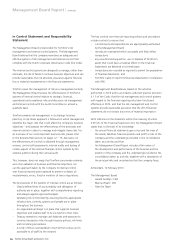
Through our cost saving initiatives we decreased our selling,
general and administrative expenses from €209 million in 2011
to €170 million in 2012, a decrease of 19% (2011: €202 million
excluding restructuring charges). We continued to simplify our
legal and operating structure and increased operational effi ciency.
The table below presents developments in our operating expenses
during 2010, 2011 and 2012.
Financial income and expenses
—
Net fi nancial expense for 2012 was €9.7 million (2011:
€16 million). This consisted mainly of net interest expense of
€12 million (2011: €22 million) and other fi nancial gains of
€1.6 million (2011: €6.1 million). The decline in the net interest
expense is mainly due to lower debt in 2012 as the result of
repayments at the end of 2011 and throughout 2012. Other
fi nancial gains consisted mainly of positive foreign currency
revaluation results on our balance sheet items.
Taxation
—
In 2012 we had an income tax gain of €69 million compared to
a charge of €13 million in 2011 (excluding the tax effect of the
impairment and restructuring charges). The income tax gain results
from a €80 million settlement we agreed upon with the Dutch tax
authority on prior years’ tax discussions. Excluding the impact of
this settlement, our effective tax rate in 2012 would have been
18.8%.
Net result
—
The net result for the year was €129 million, compared to a loss
of €439 million in 2011. Excluding the impact of impairment,
restructuring charges and the one-off tax gain the net result
decreased by €24 million.
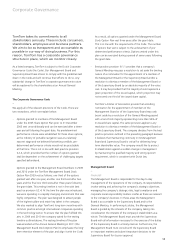
Liquidity and capital resources
—
Cash fl ow from operations amounted to €187 million in 2012,
a decrease of 4% compared to €195 million in 2011. As a
percentage of revenue, cash fl ow from operations increased
from 15% in 2011 to 18% in 2012.
Capital expenditures amounted to €52 million in 2012. These
consisted mainly of €43 million in investments in intangible assets
and €9 million on property, plant and equipment.
On the fi nancing side, during 2012 we made a net repayment on
our borrowings of €138 million.
Our cash position was €164 million as at 31 December 2012.
Debt fi nancing
—
On 31 December 2012 we made the fi nal repayment on the
outstanding amount of the loan we entered into in 2008.
At the same time we drew down on the new €250 million term
loan.
Management Board Report | continued
600
500
400
300
200
100
201220112010
0
Research & development expenses
Amortisation of technology and databases
Marketing expenses
Selling, general and administrative expenses
Stock compensation
13 87
197 202
170
105 77
57
162 167
166
78 85
84
0
100
150
200
250
350
400
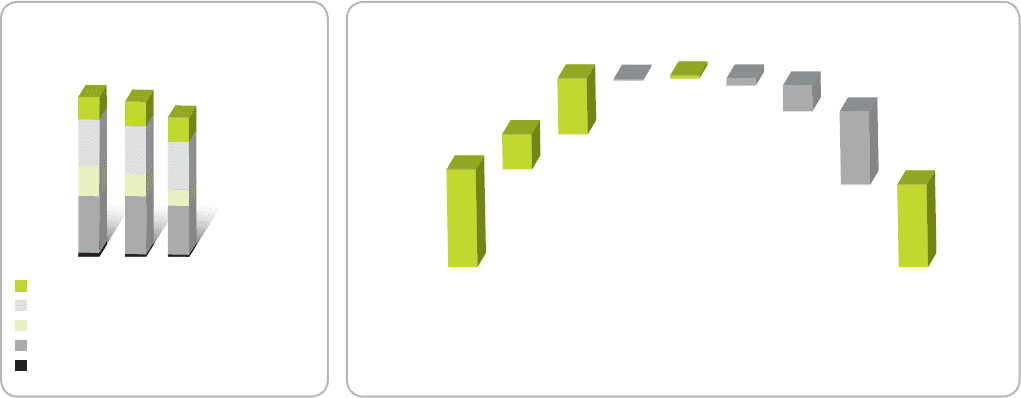
Cash position
31 December
2011
Operating
result
Depreciation
&
Amortisation
Working
capital
Other
non-
cash
items
Interest,
taxes and
other
Investments Financing Cash position
31 December
2012
194
70
111 10
– 4 – 20 – 51
– 146
164
Operating expenses1
(€ in millions)
Cash fl ow development
(€ in millions)
1 Excluding restructuring and impairment charges.