TomTom 2012 Annual Report Download - page 7
Download and view the complete annual report
Please find page 7 of the 2012 TomTom annual report below. You can navigate through the pages in the report by either clicking on the pages listed below, or by using the keyword search tool below to find specific information within the annual report.-
 1
1 -
 2
2 -
 3
3 -
 4
4 -
 5
5 -
 6
6 -
 7
7 -
 8
8 -
 9
9 -
 10
10 -
 11
11 -
 12
12 -
 13
13 -
 14
14 -
 15
15 -
 16
16 -
 17
17 -
 18
18 -
19
-
20
-
21
-
22
-
23
-
24
-
25
-
26
-
27
-
28
-
29
-
30
-
31
-
32
-
33
-
34
-
35
-
36
-
37
-
38
-
39
-
40
-
41
-
42
-
43
-
44
-
45
-
46
-
47
-
48
-
49
-
50
-
51
-
52
-
53
-
54
-
55
-
56
-
57
-
58
-
59
-
60
-
61
-
62
-
63
-
64
-
65
-
66
-
67
-
68
-
69
-
70
-
71
-
72
-
73
-
74
-
75
-
76
-
77
-
78
-
79
-
80
-
81
-
82
-
83
-
84
 |
 |

5
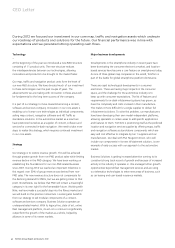
In 2012 a macro-economic headwind continued
to infl uence business conditions in Europe. In
particular, weak consumer sentiment negatively
impacted demand for consumer electronics and
new car sales, a ecting our sales of PNDs and
automotive products. However, we were able to
maintain our profi tability at the anticipated level
in this challenging environment through strong
gross margins and tight control of operating
costs.
Financial and Business Review
Overview
—
TomTom generated revenue of €1.1 billion in 2012; this represented
a decline of 17% compared to revenue of €1.3 billion in 2011.
Our gross margin increased by 2 percentage points to 52%.
During 2012 TomTom made signifi cant progress on costs to align
them with the decline in revenue. Excluding the impairment and
restructuring charges recorded in 2011, the operating expenses
reduced by 10% or €53 million. These savings were ahead of
the target to reduce operating expenses to around €500 million.
Total operating costs for the group in 2012 were €484 million.
The operating result was €70 million (2011: €102 million
excluding impairment and restructuring charges) and the adjusted
earnings per share were €0.40 (2011: €0.55)
Net debt decreased from €194 million at the beginning of the year
to €86 million as of 31 December 2012.
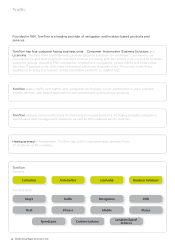
Business Review
—
Consumer
The Consumer business unit was confronted early in the year
with a malfunctioning component that had been supplied by a
third party and integrated in a number of our products. TomTom
moved quickly to offer a fi x, but the resultant decline in our North
American market share only began to recover later in the year.
In North America our market share for the year was 22%, down
fi ve percentage points compared to 2011. This was also partly due
to the decision not to participate in large promotional activities in
the Christmas holiday season. In Europe our market share for the
year was 46%, which was one percentage point up compared to
2011.
Consumer revenue decreased year-on-year by €194 million to
€639 million mainly due to decline in PND revenue. Revenue
from LIVE Services and the SportWatch that we developed in
partnership with Nike grew strongly year-on-year. However,
growth in these areas did not compensate for the decline in PND
sales.
Management Board Report
Key fi gures (in € millions)
2012
% of
revenue
2011
% of
revenue
2010
% of
revenue
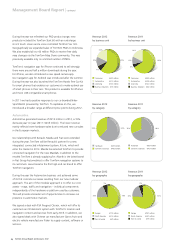
Consumer 639 60% 833 66% 1,158 76%
Automotive 212 20% 235 18% 179 12%
Licensing 133 13% 142 11% 131 9%
Business Solutions 73 7% 64 5% 53 3%
Hardware 657 62% 867 68% 1,164 77%
Content & Services 400 38% 407 32% 357 23%
TOTAL REVENUE 1,057 100% 1,273 100% 1,521 100%
GROSS RESULT 555 52% 640 50% 744 49%
OPERATING EXPENSES1484 46% 1,064 558 37%
OPERATING RESULT 70 7% – 425 186 12%
EBITDA 181 17% 206 295 19%
NET RESULT 129 12% – 439 108 7%
1 Operating expenses include a €512 million impairment charge in 2011 and restructuring expenses of €15 million in 2011 and €3.3 million in 2010.