TomTom 2012 Annual Report Download - page 59
Download and view the complete annual report
Please find page 59 of the 2012 TomTom annual report below. You can navigate through the pages in the report by either clicking on the pages listed below, or by using the keyword search tool below to find specific information within the annual report.-
 1
1 -
2
-
3
-
4
-
5
-
6
-
7
-
8
-
9
-
10
-
11
-
12
-
13
-
14
-
15
-
16
-
17
-
18
-
19
-
20
-
21
-
22
-
23
-
24
-
25
-
26
-
27
-
28
-
29
-
30
-
31
-
32
-
33
-
34
-
35
-
36
-
37
-
38
-
39
-
40
-
41
-
42
-
43
-
44
-
45
-
46
-
47
-
48
-
 49
49 -
 50
50 -
 51
51 -
 52
52 -
 53
53 -
 54
54 -
 55
55 -
 56
56 -
 57
57 -
 58
58 -
 59
59 -
 60
60 -
 61
61 -
 62
62 -
 63
63 -
 64
64 -
 65
65 -
 66
66 -
 67
67 -
 68
68 -
 69
69 -
70
-
71
-
72
-
73
-
74
-
75
-
76
-
77
-
78
-
79
-
80
-
81
-
82
-
83
-
84
 |
 |

57
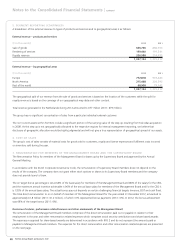
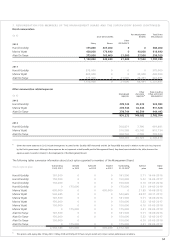
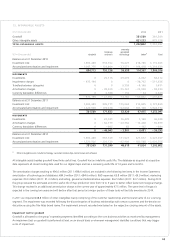
14. PROPERTY, PLANT AND EQUIPMENT
(€ in thousands)
Furniture and
fi xtures
Computer
hardware Other Total
Balance as at 31 December 2010
Investment cost 16,503 65,414 47,226 129,143
Accumulated depreciation – 13,522 – 51,326 – 25,318 – 90,166
2,981 14,088 21,908 38,977
MOVEMENTS
Investments 1,321 9,065 5,470 15,856
Transfer between categories (net) 0 2,175 – 3,785 – 1,610
Depreciation charges – 2,048 – 12,812 – 5,647 – 20,507
Currency translation differences – 27 – 73 – 61 – 161
– 754 – 1,645 – 4,023 – 6,422
Balance as at 31 December 2011
Investment cost 17,797 65,040 41,932 124,769
Accumulated depreciation – 15,570 – 52,597 – 24,047 – 92,214
2,227 12,443 17,885 32,555
MOVEMENTS
Investments 271 5,330 3,872 9,473
Transfer between categories (net) 0 1,504 – 1,504 0
Depreciation charges – 935 – 7,004 – 6,732 – 14,671
Currency translation differences 166 26 – 779 – 587
– 498 – 144 – 5,143 – 5,785
Balance as at 31 December 2012
Investment cost 18,069 70,703 43,383 132,155
Accumulated depreciation – 16,340 – 58,404 – 30,641 – 105,385
1,729 12,299 12,742 26,770
1 Other assets as at 31 December 2012 mainly comprises of leasehold improvements with a carrying value of €5.8 million (31 December 2011: €6.0 million).
No impairment of property, plant and equipment was identifi ed during the accounting period.
The carrying value of fi xed assets held under fi nance leases at 31 December 2012 was nil (2011: nil).
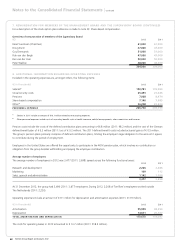
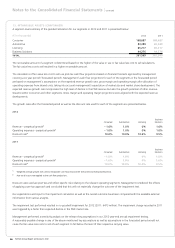
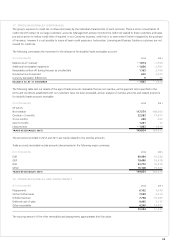
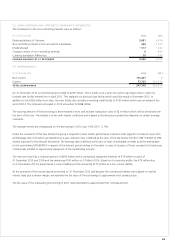
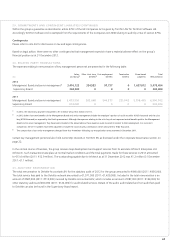
15. INVESTMENTS IN ASSOCIATES
The movements in the investments in associates can be specifi ed as follows:
(€ in thousands) 2012 2011
BALANCE AS AT 1 JANUARY 4,450 7,720
Investments in associates 160 364
Result associates 726 – 432
Disposal of associate 0– 29
Dividends received – 1,487 – 1,628
Other direct equity movements 31 – 1,545
BALANCE AS AT 31 DECEMBER 3,880 4,450
1