Thrifty Car Rental 2007 Annual Report Download - page 84
Download and view the complete annual report
Please find page 84 of the 2007 Thrifty Car Rental annual report below. You can navigate through the pages in the report by either clicking on the pages listed below, or by using the keyword search tool below to find specific information within the annual report.-
 1
1 -
2
-
3
-
4
-
5
-
6
-
7
-
8
-
9
-
10
-
11
-
12
-
13
-
14
-
15
-
16
-
17
-
18
-
19
-
20
-
21
-
22
-
23
-
24
-
25
-
26
-
27
-
28
-
29
-
30
-
31
-
32
-
33
-
34
-
35
-
36
-
37
-
38
-
39
-
40
-
41
-
42
-
43
-
44
-
45
-
46
-
47
-
48
-
49
-
50
-
51
-
52
-
53
-
54
-
55
-
56
-
57
-
58
-
59
-
60
-
61
-
62
-
63
-
64
-
65
-
66
-
67
-
68
-
69
-
70
-
71
-
72
-
73
-
 74
74 -
 75
75 -
 76
76 -
 77
77 -
 78
78 -
 79
79 -
 80
80 -
 81
81 -
 82
82 -
 83
83 -
 84
84 -
 85
85 -
 86
86 -
 87
87 -
 88
88 -
 89
89 -
 90
90 -
 91
91 -
 92
92 -
 93
93 -
 94
94 -
95
-
96
-
97
-
98
-
99
-
100
-
101
-
102
-
103
-
104
-
105
-
106
-
107
-
108
-
109
-
110
-
111
-
112
-
113
-
114
 |
 |

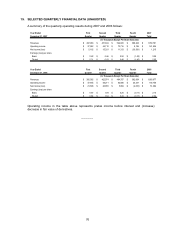
19. SELECTED QUARTERLY FINANCIAL DATA (UNAUDITED)
A summary of the quarterly operating results during 2007 and 2006 follows:
Year Ended First Second Third Fourth 2007
December 31, 2007 Quarter Quarter Quarter Quarter Total
Revenues 397,963$ 451,604$ 522,020$ 389,204$ 1,760,791$
Operating income 37,942$ 44,712$ 73,716$ 5,156$ 161,526$
Net income (loss) 5,162$ 15,321$ 11,313$ (30,581)$ 1,215$
Earnings (loss) per share
Basic 0.22$ 0.66$ 0.50$ (1.45)$ 0.05$
Diluted 0.21$ 0.63$ 0.48$ (1.45)$ 0.05$
Year Ended First Second Third Fourth 2006
December 31, 2006 Quarter Quarter Quarter Quarter Total
Revenues 360,562$ 422,574$ 484,707$ 392,834$ 1,660,677$
Operating income 47,455$ 58,271$ 62,695$ 25,337$ 193,758$
Net income (loss) 21,806$ 26,655$ 5,884$ (2,653)$ 51,692$
Earnings (loss) per share
Basic 0.87$ 1.09$ 0.25$ (0.11)$ 2.14$
Diluted 0.84$ 1.04$ 0.24$ (0.11)$ 2.04$
(In Thousands Except Per Share Amounts)
(In Thousands Except Per Share Amounts)
Operating income in the table above represents pretax income before interest and (increase)
decrease in fair value of derivatives.
******
76