Thrifty Car Rental 2007 Annual Report Download - page 34
Download and view the complete annual report
Please find page 34 of the 2007 Thrifty Car Rental annual report below. You can navigate through the pages in the report by either clicking on the pages listed below, or by using the keyword search tool below to find specific information within the annual report.-
 1
1 -
2
-
3
-
4
-
5
-
6
-
7
-
8
-
9
-
10
-
11
-
12
-
13
-
14
-
15
-
16
-
17
-
18
-
19
-
20
-
21
-
22
-
23
-
 24
24 -
 25
25 -
 26
26 -
 27
27 -
 28
28 -
 29
29 -
 30
30 -
 31
31 -
 32
32 -
 33
33 -
 34
34 -
 35
35 -
 36
36 -
 37
37 -
 38
38 -
 39
39 -
 40
40 -
 41
41 -
 42
42 -
 43
43 -
 44
44 -
45
-
46
-
47
-
48
-
49
-
50
-
51
-
52
-
53
-
54
-
55
-
56
-
57
-
58
-
59
-
60
-
61
-
62
-
63
-
64
-
65
-
66
-
67
-
68
-
69
-
70
-
71
-
72
-
73
-
74
-
75
-
76
-
77
-
78
-
79
-
80
-
81
-
82
-
83
-
84
-
85
-
86
-
87
-
88
-
89
-
90
-
91
-
92
-
93
-
94
-
95
-
96
-
97
-
98
-
99
-
100
-
101
-
102
-
103
-
104
-
105
-
106
-
107
-
108
-
109
-
110
-
111
-
112
-
113
-
114
 |
 |

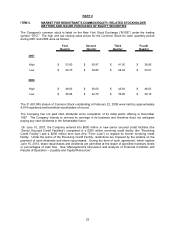
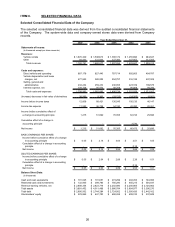
ITEM 6. SELECTED FINANCIAL DATA
Selected Consolidated Financial Data of the Company
The selected consolidated financial data was derived from the audited consolidated financial statements
of the Company. The system-wide data and company-owned stores data were derived from Company
records.
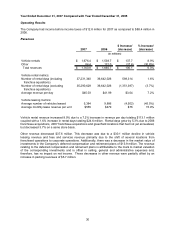
2007 2006 2005 2004 2003
Statements of Income:
(in thousands except per share amounts)
Revenues:
Vehicle rentals 1,676,349$ 1,538,673$ 1,380,172$ 1,255,890$ 994,647$
Other 84,442 122,004 127,382 147,957 213,765
Total revenues 1,760,791 1,660,677 1,507,554 1,403,847 1,208,412
Costs and expenses:
Direct vehicle and operating 887,178 827,440 787,714 692,803 484,787
Vehicle depreciation and lease
charges, net 477,853 380,005 294,757 316,199 407,509
Selling, general and
administrative 234,234 259,474 236,055 223,109 189,575
Interest expense, net 109,728 95,974 88,208 90,868 89,296
Total costs and expenses 1,708,993 1,562,893 1,406,734 1,322,979 1,171,167
(Increase) decrease in fair value of derivatives 38,990 9,363 (29,725) (24,265) (8,902)
Income before income taxes 12,808 88,421 130,545 105,133 46,147
Income tax expense 11,593 36,729 54,190 42,390 20,451
Income before cumulative effect of
a change in accounting principle 1,215 51,692 76,355 62,743 25,696
Cumulative effect of a change in
accounting principle - - - 3,730 -
Net income 1,215$ 51,692$ 76,355$ 66,473$ 25,696$
BASIC EARNINGS PER SHARE:
Income before cumulative effect of a change
in accounting principle 0.05$ 2.14$ 3.04$ 2.51$ 1.05$
Cumulative effect of a change in accounting
principle - - -
0.15 -
Net income 0.05$ 2.14$ 3.04$ 2.66$ 1.05$
DILUTED EARNINGS PER SHARE:
Income before cumulative effect of a change
in accounting principle 0.05$ 2.04$ 2.89$ 2.39$ 1.01$
Cumulative effect of a change in accounting
principle - - - 0.14 -
Net income 0.05$ 2.04$ 2.89$ 2.53$ 1.01$
Balance Sheet Data:
(in thousands)
Cash and cash equivalents 101,025$ 191,981$ 274,299$ 204,453$ 192,006$
Restricted cash and investments 132,945$ 389,794$ 785,290$ 455,215$ 536,547$
Revenue-earning vehicles, net 2,808,354$ 2,623,719$ 2,202,890$ 2,256,905$ 2,126,862$
Total assets 3,891,452$ 4,011,498$ 3,986,784$ 3,604,977$ 3,396,270$
Total debt 2,656,562$ 2,744,284$ 2,724,952$ 2,500,426$ 2,442,162$
Stockholders' equity 578,865$ 647,700$ 690,428$ 608,743$ 537,849$
Year Ended December 31,
26