Thrifty Car Rental 2007 Annual Report Download - page 41
Download and view the complete annual report
Please find page 41 of the 2007 Thrifty Car Rental annual report below. You can navigate through the pages in the report by either clicking on the pages listed below, or by using the keyword search tool below to find specific information within the annual report.-
 1
1 -
2
-
3
-
4
-
5
-
6
-
7
-
8
-
9
-
10
-
11
-
12
-
13
-
14
-
15
-
16
-
17
-
18
-
19
-
20
-
21
-
22
-
23
-
24
-
25
-
26
-
27
-
28
-
29
-
30
-
 31
31 -
 32
32 -
 33
33 -
 34
34 -
 35
35 -
 36
36 -
 37
37 -
 38
38 -
 39
39 -
 40
40 -
 41
41 -
 42
42 -
 43
43 -
 44
44 -
 45
45 -
 46
46 -
 47
47 -
 48
48 -
 49
49 -
 50
50 -
 51
51 -
52
-
53
-
54
-
55
-
56
-
57
-
58
-
59
-
60
-
61
-
62
-
63
-
64
-
65
-
66
-
67
-
68
-
69
-
70
-
71
-
72
-
73
-
74
-
75
-
76
-
77
-
78
-
79
-
80
-
81
-
82
-
83
-
84
-
85
-
86
-
87
-
88
-
89
-
90
-
91
-
92
-
93
-
94
-
95
-
96
-
97
-
98
-
99
-
100
-
101
-
102
-
103
-
104
-
105
-
106
-
107
-
108
-
109
-
110
-
111
-
112
-
113
-
114
 |
 |

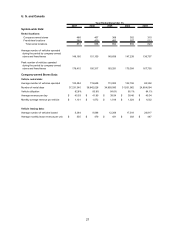
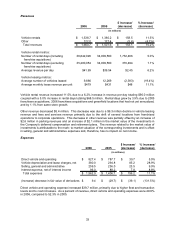
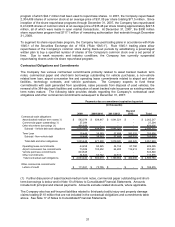
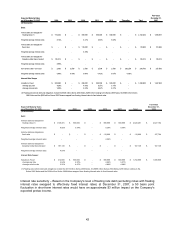
Revenues
$ Increase/ % Increase/
2006 2005 (decrease) (decrease)
Vehicle rentals 1,538.7$ 1,380.2$ 158.5$ 11.5%
Other 122.0 127.4 (5.4) (4.2%)
Total revenues 1,660.7$ 1,507.6$ 153.1$ 10.2%
Vehicle rental metrics:
Number of rental days (including 36,642,026 34,909,560 1,732,466 5.0%
franchise aquisitions)
Number of rental days (excluding 35,280,054 34,909,560 370,494 1.1%
franchise aquisitions)
Average revenue per day $41.99 $39.54 $2.45 6.2%
Vehicle leasing metrics:
Average number of vehicles leased 9,886 12,269 (2,383) (19.4%)
Average monthly lease revenue per unit $479 $431 $48 11.1%
(in millions)
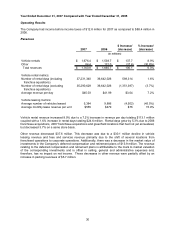
Vehicle rental revenue increased 11.5% due to a 6.2% increase in revenue per day totaling $90.0 million
coupled with a 5.0% increase in rental days totaling $68.5 million. Rental days grew by 3.9% due to 2005
franchisee acquisitions, 2006 franchisee acquisitions and greenfield locations that had not yet annualized,
and by 1.1% from same store growth.
Other revenue decreased $5.4 million. This decrease was due to a $9.3 million decline in vehicle leasing
revenue and fees and services revenue primarily due to the shift of several locations from franchised
operations to corporate operations. This decrease in other revenue was partially offset by an increase of
$2.6 million in parking revenues and an increase of $2.1 million in the market value of the investments in
the Company’s deferred compensation and retirement plans. The revenue related to the market value of
investments is attributable to the mark- to-market valuation of the corresponding investments and is offset
in selling, general and administrative expenses and, therefore, has no impact on net income.
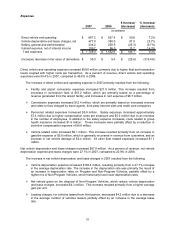
Expenses
$ Increase/ % Increase/
2006 2005 (decrease) (decrease)
Direct vehicle and operating 827.4$ 787.7$ 39.7$ 5.0%
Vehicle depreciation and lease charges, net 380.0 294.8 85.2 28.9%
Selling, general and administrative 259.5 236.0 23.5 9.9%
Interest expense, net of interest income 96.0 88.2 7.8 8.8%
Total expenses 1,562.9$ 1,406.7$ 156.2$ 11.1%
(Increase) decrease in fair value of derivatives 9.4$ (29.7)$ (39.1)$ (131.5%)
(in millions)
Direct vehicle and operating expense increased $39.7 million, primarily due to higher fleet and transaction
levels and to cost increases. As a percent of revenue, direct vehicle and operating expenses were 49.8%
in 2006, compared to 52.3% in 2005.
33