Tesco 2015 Annual Report Download - page 23
Download and view the complete annual report
Please find page 23 of the 2015 Tesco annual report below. You can navigate through the pages in the report by either clicking on the pages listed below, or by using the keyword search tool below to find specific information within the annual report.-
 1
1 -
2
-
3
-
4
-
5
-
6
-
7
-
8
-
9
-
10
-
11
-
12
-
 13
13 -
 14
14 -
 15
15 -
 16
16 -
 17
17 -
 18
18 -
 19
19 -
 20
20 -
 21
21 -
 22
22 -
 23
23 -
 24
24 -
 25
25 -
 26
26 -
 27
27 -
 28
28 -
 29
29 -
 30
30 -
 31
31 -
 32
32 -
 33
33 -
34
-
35
-
36
-
37
-
38
-
39
-
40
-
41
-
42
-
43
-
44
-
45
-
46
-
47
-
48
-
49
-
50
-
51
-
52
-
53
-
54
-
55
-
56
-
57
-
58
-
59
-
60
-
61
-
62
-
63
-
64
-
65
-
66
-
67
-
68
-
69
-
70
-
71
-
72
-
73
-
74
-
75
-
76
-
77
-
78
-
79
-
80
-
81
-
82
-
83
-
84
-
85
-
86
-
87
-
88
-
89
-
90
-
91
-
92
-
93
-
94
-
95
-
96
-
97
-
98
-
99
-
100
-
101
-
102
-
103
-
104
-
105
-
106
-
107
-
108
-
109
-
110
-
111
-
112
-
113
-
114
-
115
-
116
-
117
-
118
-
119
-
120
-
121
-
122
-
123
-
124
-
125
-
126
-
127
-
128
-
129
-
130
-
131
-
132
-
133
-
134
-
135
-
136
-
137
-
138
-
139
-
140
-
141
-
142
-
143
-
144
-
145
-
146
-
147
-
148
-
149
-
150
-
151
-
152
-
153
-
154
-
155
-
156
-
157
-
158
-
159
-
160
 |
 |

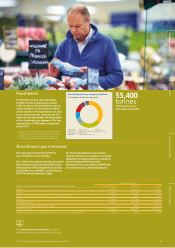
Tesco UK food waste by category breakdown
(% breakdown of total tonnage value)
Bakery 36%
Produce 25%
Convenience 9%
Dairy 8%
Frozen 2%
World Foods 2%
Impulse 6%
Meat, Fish & Poultry 5%
Grocery 4%
Beers, Wines & Spirits 3%
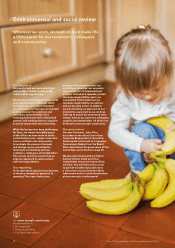
Food waste
In 2014/15 we have calculated that
55,400∆ tonnes of food were wasted
in Tesco stores and distribution centres
in the UK which is equivalent to 0.9%∆
of the number of food products we sold
in our stores over the same period. The
chart on the right shows the breakdown
of this food waste by category. This has
decreased by 1,180 tonnes compared
to 2013/14.
∆ Independent limited assurance provided by KPMG
LLP. It is important to read the data in the context
of KPMG’s full statement and Tesco’s reporting
criteria at www.tescoplc.com/foodwastefigures.
55,400
tonnes
Food waste in our
own operations (UK)
Our net carbon footprint in 2014/15
was 5.6 million tonnes of CO2e.
Our overall net carbon intensity per square
foot of retail and distribution floor space
decreased by 4.3% compared to last year,
and 40.9% since 2006/07, surpassing our
2014/15 annual reduction target.
For more information on our carbon
targets and how we calculate our carbon
footprint, including reporting standards
and an Independent Assurance
Statement from our auditors (ERMCVS),
see www.tescoplc.com/carbonfigures.
GHG emissions data for period 23 February 2014 to 28 February 2015
Global tonnes of CO2e
Base year 2006/07 2013/14 2014/15
Scope 1 1,311,109 1,320,122 1,313,291
Scope 2 2,503,597 3,036,282 3,145,907
Scope 1 and 2 carbon intensity (kg CO2e/sq. ft. of stores and DCs) 49.63 30.65 30.11
Scope 3 1,129,699 1, 287,6 61 1,166,743
Total gross emissions 4,944,405 5,644,066 5,625,941
CO2e from renewable energy exported to grid – 163.63 680.16
Total net emissions 4,944,405 5,643,902 5,625,261
Overall net carbon intensity (total net emissions kg CO2e/sq. ft. of stores and DCs) 64.33 39.71 37.99
21Tesco PLC Annual Report and Financial Statements 2015
Other informationGovernance Financial statementsStrategic report
Greenhouse gas emissions
Visit www.tesco.com/society for more
information on our policies and disclosures