Tesco 2015 Annual Report Download - page 123
Download and view the complete annual report
Please find page 123 of the 2015 Tesco annual report below. You can navigate through the pages in the report by either clicking on the pages listed below, or by using the keyword search tool below to find specific information within the annual report.-
 1
1 -
2
-
3
-
4
-
5
-
6
-
7
-
8
-
9
-
10
-
11
-
12
-
13
-
14
-
15
-
16
-
17
-
18
-
19
-
20
-
21
-
22
-
23
-
24
-
25
-
26
-
27
-
28
-
29
-
30
-
31
-
32
-
33
-
34
-
35
-
36
-
37
-
38
-
39
-
40
-
41
-
42
-
43
-
44
-
45
-
46
-
47
-
48
-
49
-
50
-
51
-
52
-
53
-
54
-
55
-
56
-
57
-
58
-
59
-
60
-
61
-
62
-
63
-
64
-
65
-
66
-
67
-
68
-
69
-
70
-
71
-
72
-
73
-
74
-
75
-
76
-
77
-
78
-
79
-
80
-
81
-
82
-
83
-
84
-
85
-
86
-
87
-
88
-
89
-
90
-
91
-
92
-
93
-
94
-
95
-
96
-
97
-
98
-
99
-
100
-
101
-
102
-
103
-
104
-
105
-
106
-
107
-
108
-
109
-
110
-
111
-
112
-
 113
113 -
 114
114 -
 115
115 -
 116
116 -
 117
117 -
 118
118 -
 119
119 -
 120
120 -
 121
121 -
 122
122 -
 123
123 -
 124
124 -
 125
125 -
 126
126 -
 127
127 -
 128
128 -
 129
129 -
 130
130 -
 131
131 -
 132
132 -
 133
133 -
134
-
135
-
136
-
137
-
138
-
139
-
140
-
141
-
142
-
143
-
144
-
145
-
146
-
147
-
148
-
149
-
150
-
151
-
152
-
153
-
154
-
155
-
156
-
157
-
158
-
159
-
160
 |
 |

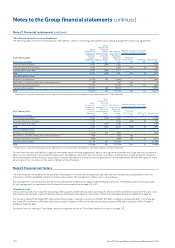
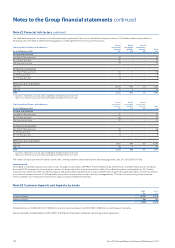
Note 22 Financial risk factors continued
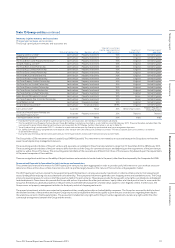
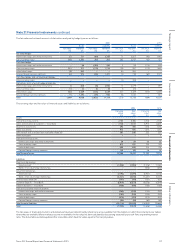
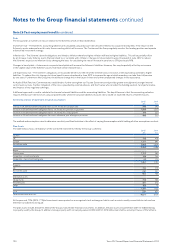
During 2015 and 2014, net debt was managed using derivative instruments to hedge interest rate risk.
2015 2014
Fixed
£m
Floating
£m
Total
£m
Fixed
£m
Floating
£m
Total
£m
Cash and cash equivalents –2,165 2,165 –2,506 2,506
Loans and advances to customers – Tesco Bank 4,041 3,679 7,720 3,440 3,475 6,915
Short-term investments – 593 593 –1,016 1,016
Other investments 904 71 975 855 160 1,015
Joint venture and associate loan receivables (Note 28) 141 66 207 163 92 255
Other receivables 1 – 1 1 – 1
Finance leases (Note 34) (141) –(141) (90) (31) (121)
Bank and other borrowings (10,571) (1,947) (12,518 ) (9,788) (1,304) (11,092)
Customer deposits – Tesco Bank (2,868) (4,046) (6,914) (2,707) (3,371) (6,078)
Deposits from banks – Tesco Bank (106) –(106) (780) –(780)
Derivative effect:
Interest-rate swaps (6,523) 6,523 –(4,022) 4,022 –
Cross-currency swaps 1,973 (1,973) –2,418 (2,418) –
Index-linked swaps (567) 567 –(553) 553 –
Total (13,716) 5,698 (8,018) (11,063) 4,700 (6,363)
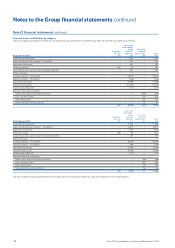
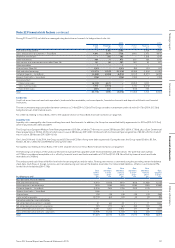
Credit risk
Credit risk arises from cash and cash equivalents, trade and other receivables, customer deposits, financial instruments and deposits with banks and financial
institutions.
The net counterparty exposure under derivative contracts is £1.4bn (2014: £1.2bn). The Group considers its maximum credit risk to be £14.7bn (2014: £13.3bn)
being the Group’s total financial assets.
For credit risk relating to Tesco Bank, refer to the separate section on Tesco Bank financial risk factors on page 123.
Liquidity risk
Liquidity risk is managed by short-term and long-term cash flow forecasts. In addition, the Group has committed facility agreements for £5.1bn (2014: £2.7bn),
which mature between 2016 and 2019.
The Group has a European Medium Term Note programme of £15.0bn, of which £7.4bn was in issue at 28 February 2015 (2014: £7.0bn), plus a Euro Commercial
Paper programme of £2.0bn, £0.5bn of which was in issue at 28 February 2015 (2014: £nil), and a US Commercial Paper programme of $4.0bn, £0.7bn of which
was in issue at 28 February 2015 (2014: £nil).
On 6 June 2014 and 1 July 2014, the Group issued £0.5bn and €2.0bn of long-term debt respectively. During the year, the Group repaid £0.6bn, $0.5bn,
€0.6bn, ¥6.5bn, CNY0.7bn and MYR0.1bn of long-term debt.
For liquidity risk relating to Tesco Bank, refer to the separate section on Tesco Bank financial risk factors on page 123.
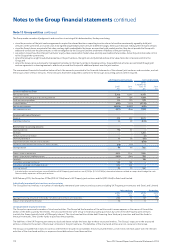
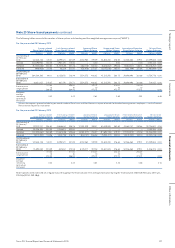
The following is an analysis of the undiscounted contractual cash flows payable under financial liabilities and derivatives. The potential cash outflow
of £17.8bn is considered acceptable as it is offset by financial assets and trade receivables of £14.7bn (2014: £18.2bn offset by financial assets and trade
receivables of £14.8bn).
The undiscounted cash flows will differ from both the carrying values and fair value. Floating rate interest is estimated using the prevailing rate at the balance
sheet date. Cash flows in foreign currencies are translated using spot rates at the balance sheet date. For index-linked liabilities, inflation is estimated at 3%
for the life of the liability (2014: 3%).
At 28 February 2015
Due
within
1 year
£m
Due
between
1 and 2
years
£m
Due
between
2 and 3
years
£m
Due
between
3 and 4
years
£m
Due
between
4 and 5
years
£m
Due
beyond
5 years
£m
Non-derivative financial liabilities
Bank and other borrowings (1,975) (1,400) (915) (670) (1,468) (5,758)
Interest payments on borrowings (403) (406) (343) (306) (283) (2,968)
Customer deposits – Tesco Bank (5,914) (561) (124) (142) (173) –
Deposits from banks – Tesco Bank (106) –––––
Finance leases (20) (19) (19) (19) (12) (168)
Trade and other payables (9,775) (62) (25) (2) (2) (56)
Derivative and other financial liabilities
Net settled derivative contracts – receipts 41 68 25 21 17 1,061
Net settled derivative contracts – payments (97) (77) (61) (42) (22) (19)
Gross settled derivative contracts – receipts 4,397 1,260 1,953 29 29 1,330
Gross settled derivative contracts – payments (3,979) (1,314) (1,735) (44) (44) (1,477)
Total (17,827) (2,515) (1,244) (1,175) (1,958) (8,055)
121Tesco PLC Annual Report and Financial Statements 2015
Other informationGovernance Financial statementsStrategic report