Tesco 2015 Annual Report Download - page 117
Download and view the complete annual report
Please find page 117 of the 2015 Tesco annual report below. You can navigate through the pages in the report by either clicking on the pages listed below, or by using the keyword search tool below to find specific information within the annual report.-
 1
1 -
2
-
3
-
4
-
5
-
6
-
7
-
8
-
9
-
10
-
11
-
12
-
13
-
14
-
15
-
16
-
17
-
18
-
19
-
20
-
21
-
22
-
23
-
24
-
25
-
26
-
27
-
28
-
29
-
30
-
31
-
32
-
33
-
34
-
35
-
36
-
37
-
38
-
39
-
40
-
41
-
42
-
43
-
44
-
45
-
46
-
47
-
48
-
49
-
50
-
51
-
52
-
53
-
54
-
55
-
56
-
57
-
58
-
59
-
60
-
61
-
62
-
63
-
64
-
65
-
66
-
67
-
68
-
69
-
70
-
71
-
72
-
73
-
74
-
75
-
76
-
77
-
78
-
79
-
80
-
81
-
82
-
83
-
84
-
85
-
86
-
87
-
88
-
89
-
90
-
91
-
92
-
93
-
94
-
95
-
96
-
97
-
98
-
99
-
100
-
101
-
102
-
103
-
104
-
105
-
106
-
 107
107 -
 108
108 -
 109
109 -
 110
110 -
 111
111 -
 112
112 -
 113
113 -
 114
114 -
 115
115 -
 116
116 -
 117
117 -
 118
118 -
 119
119 -
 120
120 -
 121
121 -
 122
122 -
 123
123 -
 124
124 -
 125
125 -
 126
126 -
 127
127 -
128
-
129
-
130
-
131
-
132
-
133
-
134
-
135
-
136
-
137
-
138
-
139
-
140
-
141
-
142
-
143
-
144
-
145
-
146
-
147
-
148
-
149
-
150
-
151
-
152
-
153
-
154
-
155
-
156
-
157
-
158
-
159
-
160
 |
 |

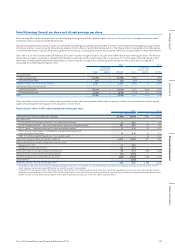
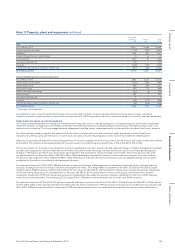
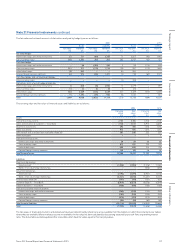
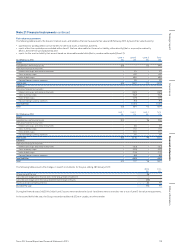
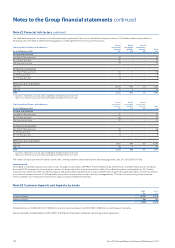
Note 20 Borrowings
Current
Par value
Maturity
year
2015
£m
2014
£m
Commercial paper, bank loans and overdrafts – – 1,982 830
Loans from joint ventures (Note 28) – – 16 16
5% MTN £600m 2014 –628
2% USD Bond $500m 2014 –300
Other MTNs – – –130
Finance leases (Note 34) – – 10 6
2,008 1,910
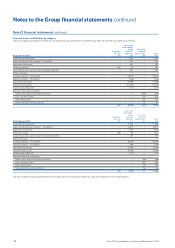
Non-current
Par value
Maturity
year
2015
£m
2014
£m
5.125% MTN €600m 2015 –528
4% RPI MTN*£307m 2016 313 304
5.875% MTN €1,039m 2016 872 1,011
2.7% USD Bond $500m 2017 325 299
1.250% MTN €500m 2017 362 411
5.5% USD Bond $850m 2017 625 595
5.2% Tesco Bank Retail Bond £125m 2018 135 139
3.375% MTN €750m 2018 548 620
LIBOR + 0.45% Tesco Bank Bond £150m 2019 149 –
1.375% MTN €1,250m 2019 911 –
5.5% MTN £350m 2019 353 352
1% RPI Tesco Bank Retail Bond £60m 2019 60 60
2.125% MTN €500m 2020 362 411
5% Tesco Bank Retail Bond £200m 2020 205 197
LIBOR + 0.65% Tesco Bank Bond £350m 2021 349 –
6.125% MTN £900m 2022 895 948
5% MTN £389m 2023 407 401
2.5% MTN €750m 2024 547 –
3.322% LPI MTN** £315m 2025 318 310
6% MTN £200m 2029 261 242
5.5% MTN £200m 2033 262 241
1.982% RPI MTN*** £261m 2036 263 256
6.15% USD Bond $1,150m 2037 917 792
4.875% MTN £173m 2042 175 174
5.125% MTN €600m 2047 631 605
5.2% MTN £279m 2057 275 274
Other loans – – –18
Finance leases (Note 34) – – 131 115
10,651 9,303
* The 4% RPI MTN is redeemable at par, including indexation for increases in the Retail Price Index (‘RPI’) over the life of the MTN.
** The 3.322% Limited Price Inflation (‘LPI’) MTN is redeemable at par, including indexation for increases in the RPI over the life of the MTN. The maximum indexation of the
principal in any one year is 5%, with a minimum of 0%.
*** The 1.982% RPI MTN is redeemable at par, including indexation for increases in the RPI over the life of the MTN.
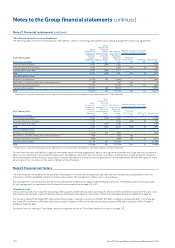
Borrowing facilities
The Group has the following undrawn committed facilities available at 28 February 2015, in respect of which all conditions precedent had been met as at that date:
2015
£m
2014
£m
Expiring in less than one year 132 –
Expiring between one and two years 200 125
Expiring in more than two years 4,800 2,600
5,132 2,725
The current year undrawn committed facilities include £2.2bn of bilateral facilities and a £2.6bn revolving credit facility.
All facilities incur commitment fees at market rates and would provide funding at floating rates.
115Tesco PLC Annual Report and Financial Statements 2015
Other informationGovernance Financial statementsStrategic report