Tesco 2015 Annual Report Download - page 107
Download and view the complete annual report
Please find page 107 of the 2015 Tesco annual report below. You can navigate through the pages in the report by either clicking on the pages listed below, or by using the keyword search tool below to find specific information within the annual report.-
 1
1 -
2
-
3
-
4
-
5
-
6
-
7
-
8
-
9
-
10
-
11
-
12
-
13
-
14
-
15
-
16
-
17
-
18
-
19
-
20
-
21
-
22
-
23
-
24
-
25
-
26
-
27
-
28
-
29
-
30
-
31
-
32
-
33
-
34
-
35
-
36
-
37
-
38
-
39
-
40
-
41
-
42
-
43
-
44
-
45
-
46
-
47
-
48
-
49
-
50
-
51
-
52
-
53
-
54
-
55
-
56
-
57
-
58
-
59
-
60
-
61
-
62
-
63
-
64
-
65
-
66
-
67
-
68
-
69
-
70
-
71
-
72
-
73
-
74
-
75
-
76
-
77
-
78
-
79
-
80
-
81
-
82
-
83
-
84
-
85
-
86
-
87
-
88
-
89
-
90
-
91
-
92
-
93
-
94
-
95
-
96
-
 97
97 -
 98
98 -
 99
99 -
 100
100 -
 101
101 -
 102
102 -
 103
103 -
 104
104 -
 105
105 -
 106
106 -
 107
107 -
 108
108 -
 109
109 -
 110
110 -
 111
111 -
 112
112 -
 113
113 -
 114
114 -
 115
115 -
 116
116 -
 117
117 -
118
-
119
-
120
-
121
-
122
-
123
-
124
-
125
-
126
-
127
-
128
-
129
-
130
-
131
-
132
-
133
-
134
-
135
-
136
-
137
-
138
-
139
-
140
-
141
-
142
-
143
-
144
-
145
-
146
-
147
-
148
-
149
-
150
-
151
-
152
-
153
-
154
-
155
-
156
-
157
-
158
-
159
-
160
 |
 |

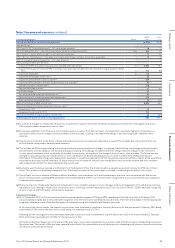
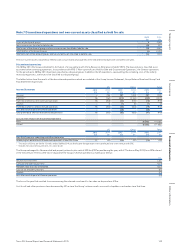
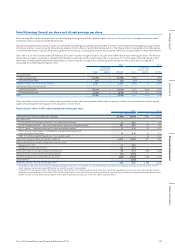
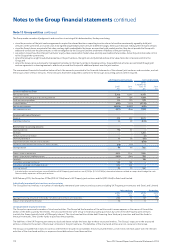
Note 9 Earnings (losses) per share and diluted earnings per share
Basic earnings/(losses) per share amounts are calculated by dividing the profit/(loss) attributable to owners of the parent by the weighted average number
of ordinary shares in issue during the financial year.
Diluted earnings/(losses) per share amounts are calculated by dividing the profit/(loss) attributable to owners of the parent by the weighted average number
of ordinary shares in issue during the financial year adjusted for the effects of potentially dilutive options. The dilutive effect is calculated on the full exercise
of all potentially dilutive ordinary share options granted by the Group, including performance-based options which the Group considers to have been earned.
Given the loss for the 53 weeks ended 28 February 2015, the Group has recognised a basic loss per share rather than a basic earnings per share. The dilutive
effects have not been considered in calculating the diluted loss per share as this would reduce the loss per share. For the 53 weeks ended 28 February 2015
there were 12 million potentially dilutive share options. As the Group has recognised an underlying profit the dilutive effects have been considered in
calculating the underlying earnings per share.
2015 2014
Basic
Potentially
dilutive share
options Diluted Basic
Potentially
dilutive share
options Diluted
(Loss)/profit (£m)
Continuing operations (5,694) –(5,694) 1,916 –1,916
Discontinued operations (47) –(47) (942) –(942)
Weighted average number of shares (millions) 8,107 –8,107 8,068 10 8,078
(Losses)/earnings per share (pence)
Continuing operations (70.24) –(70.24) 23.75 (0.03) 23.72
Discontinued operations (0.58) –(0.58) (11.68) 0.02 (11.66)
Total (70.82) –(70.82) 12.07 (0.01) 12.06
There have been no transactions involving ordinary shares between the reporting date and the date of approval of these financial statements which would
significantly change the earnings per share calculations shown above.
Reconciliation of non-GAAP underlying diluted earnings per share
2015 2014
£m Pence/share £m Pence/share
(Loss)/profit from continuing operations (diluted) (5,694) (70.24) 1,916 23.72
Adjustments for:
IAS 32 and IAS 39 ‘Financial Instruments’ – fair value remeasurements 26 0.32 11 0.14
IAS 19 ‘Employee Benefits’ – non-cash Group Income Statement charge for pensions 204 2.52 117 1.45
IAS 17 ‘Leases’ – impact of annual uplifts in rent and rent-free periods 12 0.15 22 0.27
IFRS 3 ‘Business Combinations’ – intangible asset amortisation charges and
costs arising from acquisitions 13 0.16 14 0.17
IFRIC 13 ‘Customer Loyalty Programmes’ – fair value of awards – – 10 0.12
Total restructuring and other one-off items (Note 3) 6,814 84.06 801 9.92
Reversal of commercial income recognised in previous years:
Recognised in 13/14 53 0.65 – –
Recognised in years prior to 13/14 155 1.91 – –
Other profits/(losses) arising on property-related items 60 0.74 (180) (2.23)
Allocation of adjustments to non-controlling interests (22) (0.27) – –
Tax effect of adjustments at the effective rate of tax*(856) (10.56) (122) (1.51)
Dilutive effect** –(0.02)
Underlying earnings from continuing operations 765 9.42 2,589 32.05
*
The effective rate of tax on the total tax charge on all adjustments was 11.7% (2014: 15.4%). The effective rate of tax on underlying earnings was 20.7% (2014: 15.4%)
which excludes certain permanent differences on which tax relief is not available.
**
Under IAS 33 ‘Earnings per share’, potentially dilutive share options are treated as dilutive only when their conversion would decrease earnings per share. All adjustments
above have been based on 8,107 million (2014: 8,078 million) shares, with the (0.02) pence per share dilutive impact of the 12 million current year potentially dilutive share
options factored in only when calculating the final underlying diluted earnings per share from continuing operations.
105Tesco PLC Annual Report and Financial Statements 2015
Other informationGovernance Financial statementsStrategic report