Tesco 2015 Annual Report Download - page 144
Download and view the complete annual report
Please find page 144 of the 2015 Tesco annual report below. You can navigate through the pages in the report by either clicking on the pages listed below, or by using the keyword search tool below to find specific information within the annual report.
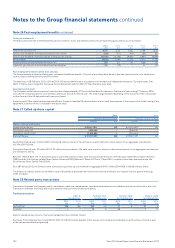
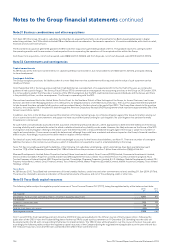
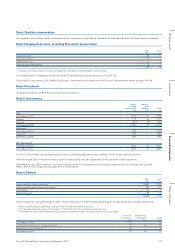
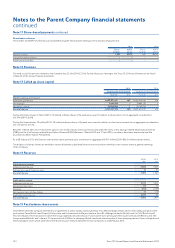
Note 7 Short-term investments
2015
£m
2014
£m
Short-term investments 593 1,016
Note 8 Other creditors
2015
£m
2014
£m
Amounts falling due within one year:
Amounts owed to Group undertakings 6,558 8,898
Other creditors 39 50
Taxation and social security 41
Accruals and deferred income 64
6,607 8,953
Amounts owed to Group undertakings are either interest-bearing or non-interest bearing depending on the type and duration of creditor relationship.
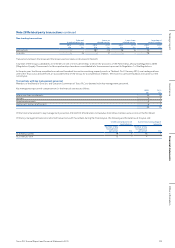
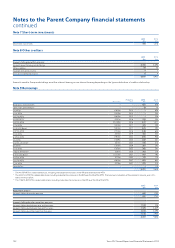
Note 9 Borrowings
Par value
Maturity
year
2015
£m
2014
£m
Bank loans and overdrafts – – 622 658
Loans from joint ventures – – 10 10
5% MTN £600m 2014 –628
2.0% MTN $500m 2014 –300
5.125% MTN €600m 2015 –528
4% RPI MTN* £307m 2016 313 304
5.875% MTN €1,039m 2016 872 1,011
2.7% MTN $500m 2017 325 299
5.5% USD Bond $850m 2017 625 595
3.375% MTN €750m 2018 548 620
5.5% MTN £350m 2019 353 352
6.125% MTN £900m 2022 895 948
5% MTN £389m 2023 407 401
3.322% LPI MTN** £315m 2025 318 310
6% MTN £200m 2029 261 242
5.5% MTN £200m 2033 262 241
1.982% RPI MTN*** £261m 2036 263 256
6.15% USD Bond $1,150m 2037 917 792
4.875% MTN £173m 2042 175 174
5.125% MTN €600m 2047 631 605
5.2% MTN £279m 2057 275 274
Other MTNs – – –110
8,072 9,658
* The 4% RPI MTN is redeemable at par, including indexation for increases in the RPI over the life of the MTN.
** The 3.322% LPI MTN is redeemable at par, including indexation for increases in the RPI over the life of the MTN. The maximum indexation of the principal in any one year is 5%,
with a minimum of 0%.
*** The 1.982% RPI MTN is redeemable at par, including indexation for increases in the RPI over the life of the MTN.
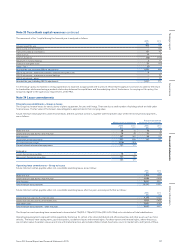
2015
£m
2014
£m
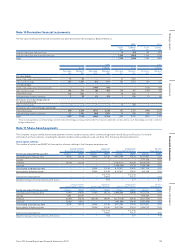
Repayment analysis:
Amounts falling due within one year 632 1,705
632 1,705
Amounts falling due after more than one year:
Amounts falling due between one and two years 1, 510 528
Amounts falling due between two and five years 1,526 2,829
Amounts falling due after more than five years 4,404 4,596
7,440 7,953
8,072 9,658
142 Tesco PLC Annual Report and Financial Statements 2015
Notes to the Parent Company financial statements
continued


