Tesco 2013 Annual Report Download - page 98
Download and view the complete annual report
Please find page 98 of the 2013 Tesco annual report below. You can navigate through the pages in the report by either clicking on the pages listed below, or by using the keyword search tool below to find specific information within the annual report.-
 1
1 -
2
-
3
-
4
-
5
-
6
-
7
-
8
-
9
-
10
-
11
-
12
-
13
-
14
-
15
-
16
-
17
-
18
-
19
-
20
-
21
-
22
-
23
-
24
-
25
-
26
-
27
-
28
-
29
-
30
-
31
-
32
-
33
-
34
-
35
-
36
-
37
-
38
-
39
-
40
-
41
-
42
-
43
-
44
-
45
-
46
-
47
-
48
-
49
-
50
-
51
-
52
-
53
-
54
-
55
-
56
-
57
-
58
-
59
-
60
-
61
-
62
-
63
-
64
-
65
-
66
-
67
-
68
-
69
-
70
-
71
-
72
-
73
-
74
-
75
-
76
-
77
-
78
-
79
-
80
-
81
-
82
-
83
-
84
-
85
-
86
-
87
-
 88
88 -
 89
89 -
 90
90 -
 91
91 -
 92
92 -
 93
93 -
 94
94 -
 95
95 -
 96
96 -
 97
97 -
 98
98 -
 99
99 -
 100
100 -
 101
101 -
 102
102 -
 103
103 -
 104
104 -
 105
105 -
 106
106 -
 107
107 -
 108
108 -
109
-
110
-
111
-
112
-
113
-
114
-
115
-
116
-
117
-
118
-
119
-
120
-
121
-
122
-
123
-
124
-
125
-
126
-
127
-
128
-
129
-
130
-
131
-
132
-
133
-
134
-
135
-
136
-
137
-
138
-
139
-
140
-
141
-
142
 |
 |

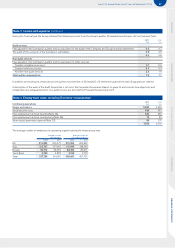
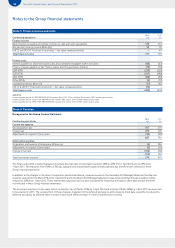
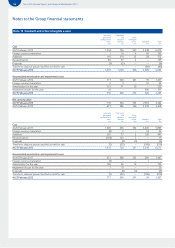
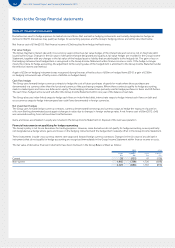
94 Tesco PLC Annual Report and Financial Statements 2013
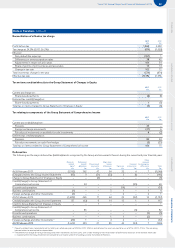
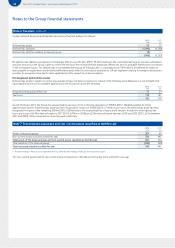
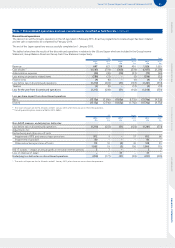
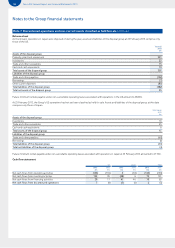
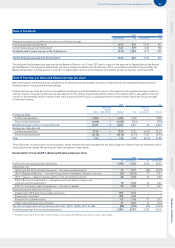
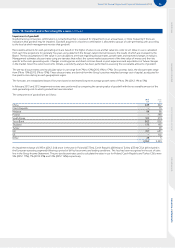
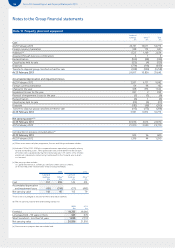
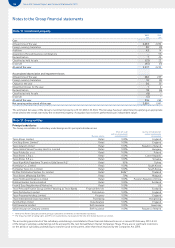
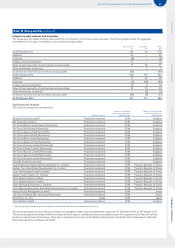
Notes to the Group financial statements
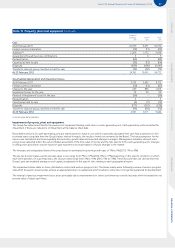
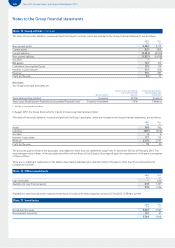
Note 10 Goodwill and other intangible assets
Internally
generated
development
costs
£m
Pharmacy
and
software
licences
£m
Other
intangible
assets
£m
Goodwill
£m
Total
£m
Cost
At 25 February 2012 1,454 726 347 3,548 6,075
Foreign currency translation 116 484 105
Additions 161 170 13 28 372
Reclassification 40 97 2 – 139
Disposals (1) (5) – – (6)
Transfer to disposal group classified as held for sale – – – (80) (80)
At 23 February 2013 1,655 1,004 366 3,580 6,605
Accumulated amortisation and impairment losses
At 25 February 2012 777 340 241 99 1,457
Foreign currency translation 2 9 – 32 43
Amortisation for the year 121 91 20 –232
Impairment losses for the year 16 – – 495 511
At 23 February 2013 916 440 261 626 2,243
Net carrying value
At 23 February 2013 739 564 105 2,954 4,362
At 25 February 2012 677 386 106 3,449 4,618
Internally
generated
development
costs
£m
Pharmacy
and
software
licences
£m
Other
intangible
assets
£m
Goodwill
£m
Total
£m
Cost
At 26 February 2011 1,300 563 342 3,600 5,805
Foreign currency translation (2) 2 – 34 34
Additions 261 77 3 100 441
Reclassification (104) 120 3 – 19
Disposals – (4) (1) – (5)
Transfer to disposal group classified as held for sale (1) (32) – (186) (219)
At 25 February 2012 1,454 726 347 3,548 6,075
Accumulated amortisation and impairment losses
At 26 February 2011 672 288 223 284 1,467
Foreign currency translation (1) – – 1 –
Amortisation for the year 106 69 19 – 194
Impairment losses for the year 1 19 – – 20
Disposals – (4) (1) – (5)
Transfer to disposal group classified as held for sale (1) (32) – (186) (219)
At 25 February 2012 777 340 241 99 1,457