Tesco 2013 Annual Report Download - page 59
Download and view the complete annual report
Please find page 59 of the 2013 Tesco annual report below. You can navigate through the pages in the report by either clicking on the pages listed below, or by using the keyword search tool below to find specific information within the annual report.-
 1
1 -
2
-
3
-
4
-
5
-
6
-
7
-
8
-
9
-
10
-
11
-
12
-
13
-
14
-
15
-
16
-
17
-
18
-
19
-
20
-
21
-
22
-
23
-
24
-
25
-
26
-
27
-
28
-
29
-
30
-
31
-
32
-
33
-
34
-
35
-
36
-
37
-
38
-
39
-
40
-
41
-
42
-
43
-
44
-
45
-
46
-
47
-
48
-
 49
49 -
 50
50 -
 51
51 -
 52
52 -
 53
53 -
 54
54 -
 55
55 -
 56
56 -
 57
57 -
 58
58 -
 59
59 -
 60
60 -
 61
61 -
 62
62 -
 63
63 -
 64
64 -
 65
65 -
 66
66 -
 67
67 -
 68
68 -
 69
69 -
70
-
71
-
72
-
73
-
74
-
75
-
76
-
77
-
78
-
79
-
80
-
81
-
82
-
83
-
84
-
85
-
86
-
87
-
88
-
89
-
90
-
91
-
92
-
93
-
94
-
95
-
96
-
97
-
98
-
99
-
100
-
101
-
102
-
103
-
104
-
105
-
106
-
107
-
108
-
109
-
110
-
111
-
112
-
113
-
114
-
115
-
116
-
117
-
118
-
119
-
120
-
121
-
122
-
123
-
124
-
125
-
126
-
127
-
128
-
129
-
130
-
131
-
132
-
133
-
134
-
135
-
136
-
137
-
138
-
139
-
140
-
141
-
142
 |
 |

55
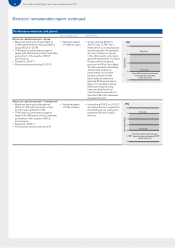
Tesco PLC Annual Report and Financial Statements 2013
OVERVIEW BUSINESS REVIEW PERFORMANCE REVIEW GOVERNANCE FINANCIAL STATEMENTS
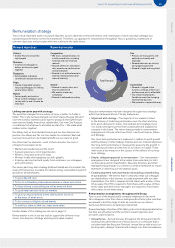
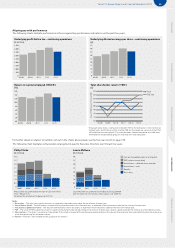
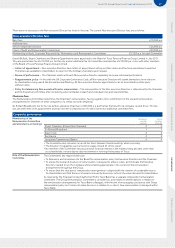
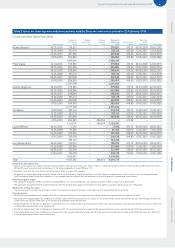
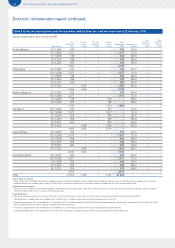
Aligning pay with performance
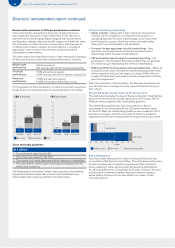
The following charts illustrate performance at Tesco against key performance indicators over the past five years.
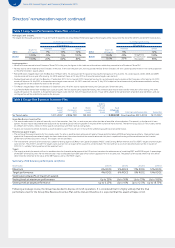
0
5
10
15
20
25
30
35
40
45
12/1311/1210/1109/1008/09
Underlying diluted earnings per share – continuing operations
(p)
0
500
1,000
1,500
2,000
2,500
3,000
3,500
4,000
4,500
12/1311/1210/1109/1008/09
Underlying profit before tax – continuing operations
(£ million)
0.0
2.0
4.0
6.0
8.0
10.0
12.0
14.0
16.0
12/1311/1210/1109/1008/09
Return on capital employed (‘ROCE’)
(%)
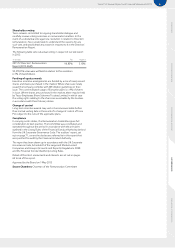
60
70
80
90
100
110
120
130
140
Feb 13Feb 12Feb 11Feb 10Feb 09Feb 08
FTSE 100
Te s co
Value of £100 invested 24 February 2008
Total shareholder return (‘TSR’)
(£)
The graph above shows a comparison between TSR for the Company’s shares for the five
financial years to 23 February 2013, and the TSR for the companies comprising the FTSE
100 index over the same period. This index has been selected to provide an established
and broad-based comparator group of retail and non-retail companies.
For further details in relation to numbers set out in the charts above please see the five year record on page 136.
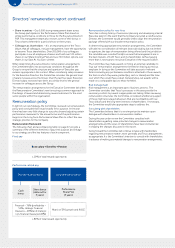
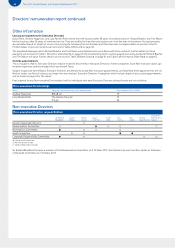
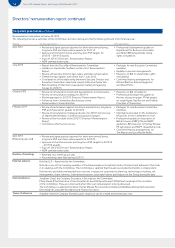
The following chart illustrates remuneration arrangements paid to Executive Directors over the last five years:
0
0.5
1.0
1.5
2.0
2.5
3.0
3.5
4.0
12/1311/1210/1109/1008/09
Philip Clarke
(£ million)
0
0.5
1.0
1.5
2.0
2.5
3.0
3.5
4.0
12/1311/1210/1109/10
Laurie Mcllwee
(£ million)
Notes
1 Base salary – The base salary paid in the year, as reported in the emoluments table for the relevant financial year.
2 Annual bonus (cash) – The cash bonus in respect of annual performance in that financial year, as reported in the emoluments table for the relevant financial year.
3 Annual bonus (deferred shares) – The value of deferred bonus shares on award, as reported in the emoluments table for the relevant financial year.
4 PSP – The value of PSP awards that vested in respect of the performance period ending in the relevant financial year. Awards valued based on the share price at the date of vesting.
5 Share options – The ‘gain’ in relation to share options that vested in respect of the performance period ending in the relevant financial year. Gain calculated based on the share price
at the date of vesting less the exercise price.
6 Pension – Pension is not included for the purpose of this analysis.
Gain on share options (gain at vesting date)
PSP (value on vesting date)
Annual bonus – deferred shares awarded
Annual bonus – cash
Benefits
Base salary
Philip Clarke was promoted to the role of CEO with effect
from 1 March 2011.
He waived his entitlement to bonus for 2011/12.
Laurie Mcllwee was promoted to the Board during 2008/09
and therefore the first full year shown above is for 2009/10.