Tesco 2013 Annual Report Download - page 109
Download and view the complete annual report
Please find page 109 of the 2013 Tesco annual report below. You can navigate through the pages in the report by either clicking on the pages listed below, or by using the keyword search tool below to find specific information within the annual report.-
 1
1 -
2
-
3
-
4
-
5
-
6
-
7
-
8
-
9
-
10
-
11
-
12
-
13
-
14
-
15
-
16
-
17
-
18
-
19
-
20
-
21
-
22
-
23
-
24
-
25
-
26
-
27
-
28
-
29
-
30
-
31
-
32
-
33
-
34
-
35
-
36
-
37
-
38
-
39
-
40
-
41
-
42
-
43
-
44
-
45
-
46
-
47
-
48
-
49
-
50
-
51
-
52
-
53
-
54
-
55
-
56
-
57
-
58
-
59
-
60
-
61
-
62
-
63
-
64
-
65
-
66
-
67
-
68
-
69
-
70
-
71
-
72
-
73
-
74
-
75
-
76
-
77
-
78
-
79
-
80
-
81
-
82
-
83
-
84
-
85
-
86
-
87
-
88
-
89
-
90
-
91
-
92
-
93
-
94
-
95
-
96
-
97
-
98
-
 99
99 -
 100
100 -
 101
101 -
 102
102 -
 103
103 -
 104
104 -
 105
105 -
 106
106 -
 107
107 -
 108
108 -
 109
109 -
 110
110 -
 111
111 -
 112
112 -
 113
113 -
 114
114 -
 115
115 -
 116
116 -
 117
117 -
 118
118 -
 119
119 -
120
-
121
-
122
-
123
-
124
-
125
-
126
-
127
-
128
-
129
-
130
-
131
-
132
-
133
-
134
-
135
-
136
-
137
-
138
-
139
-
140
-
141
-
142
 |
 |

105
Tesco PLC Annual Report and Financial Statements 2013
OVERVIEW BUSINESS REVIEW PERFORMANCE REVIEW GOVERNANCE FINANCIAL STATEMENTS
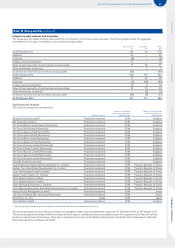
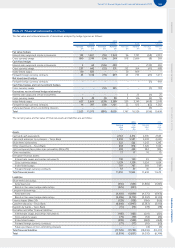
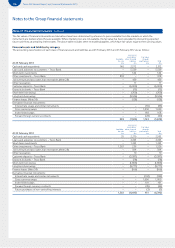
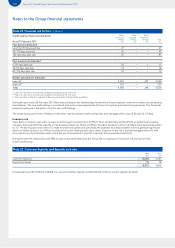
Note 21 Financial instruments continued
The fair value and notional amounts of derivatives analysed by hedge type are as follows:
2013 2012
Asset Liability Asset Liability
Fair value
£m
Notional
£m
Fair value
£m
Notional
£m
Fair value
£m
Notional
£m
Fair value
£m
Notional
£m
Fair value hedges
Interest rate swaps and similar instruments 125 1,601 (59) 1,924 96 1,751 (68) 2,031
Cross currency swaps 890 2,749 (34) 249 818 2,686 (8) 269
Cash flow hedges
Interest rate swaps and similar instruments 560 (126) 480 – – (132) 400
Cross currency swaps 237 642 (32) 531 233 304 (41) 988
Index-linked swaps 80 833 – – 30 809 – –
Forward foreign currency contracts 43 1,138 (19) 697 23 733 (21) 1,211
Net investment hedges
Forward foreign currency contracts – – – – – – (7) 969
Cash flow hedges and net investment hedges
Cross currency swaps – – (10) 325 – – (1) 318
Derivatives not in a formal hedge relationship
Interest rate swaps and similar instruments – – – – 3 25 (1) 25
Cross currency swaps 249 (3) 89 3 146 (4) 56
Index-linked swaps 627 3,604 (539) 3,589 539 3,149 (468) 3,149
Forward foreign currency contracts 14 397 (58) 1,121 22 923 (62) 1,282
Future purchases of non-controlling interests – – – – – – (3) –
Total 2,023 11,073 (880) 9,005 1,767 10,526 (816) 10,698
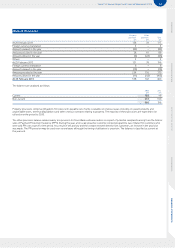
The carrying value and fair value of financial assets and liabilities are as follows:
2013 2012
Carrying
value
£m
Fair
value
£m
Carrying
value
£m
Fair
value
£m
Assets
Cash and cash equivalents 2,512 2,512 2,305 2,305
Loans and advances to customers – Tesco Bank 5,559 5,581 4,403 4,440
Short-term investments 522 522 1,243 1,243
Other investments – Tesco Bank 818 818 1,526 1,524
Joint venture and associates loan receivables (Note 28) 459 459 384 384
Other receivables 17 17 10 10
Derivative financial assets:
Interest rate swaps and similar instruments 130 130 99 99
Cross currency swaps 1,129 1,129 1,054 1,054
Index-linked swaps 707 707 569 569
Forward foreign currency contracts 57 57 45 45
Total financial assets 11,910 11,932 11,638 11,673
Liabilities
Short-term borrowings:
Amortised cost (535) (535) (1,806) (1,841)
Bonds in fair value hedge relationships (225) (221) – –
Long-term borrowings:
Amortised cost (4,450) (4,899) (4,575) (4,966)
Bonds in fair value hedge relationships (5,496) (5,114) (5,202) (5,140)
Finance leases (Note 34) (128) (128) (166) (166)
Customer deposits – Tesco Bank (6,000) (5,997) (5,387) (5,410)
Deposits by banks – Tesco Bank (15) (15) (78) (78)
Derivative and other financial liabilities:
Interest rate swaps and similar instruments (185) (185) (201) (201)
Cross currency swaps (79) (79) (54) (54)
Index-linked swaps (539) (539) (468) (468)
Forward foreign currency contracts (77) (77) (90) (90)
Future purchases of non-controlling interests – – (3) (3)
Total financial liabilities (17,729) (17,789) (18,030) (18,417)
Total (5,819) (5,857) (6,392) (6,744)