Tesco 2013 Annual Report Download - page 122
Download and view the complete annual report
Please find page 122 of the 2013 Tesco annual report below. You can navigate through the pages in the report by either clicking on the pages listed below, or by using the keyword search tool below to find specific information within the annual report.-
 1
1 -
2
-
3
-
4
-
5
-
6
-
7
-
8
-
9
-
10
-
11
-
12
-
13
-
14
-
15
-
16
-
17
-
18
-
19
-
20
-
21
-
22
-
23
-
24
-
25
-
26
-
27
-
28
-
29
-
30
-
31
-
32
-
33
-
34
-
35
-
36
-
37
-
38
-
39
-
40
-
41
-
42
-
43
-
44
-
45
-
46
-
47
-
48
-
49
-
50
-
51
-
52
-
53
-
54
-
55
-
56
-
57
-
58
-
59
-
60
-
61
-
62
-
63
-
64
-
65
-
66
-
67
-
68
-
69
-
70
-
71
-
72
-
73
-
74
-
75
-
76
-
77
-
78
-
79
-
80
-
81
-
82
-
83
-
84
-
85
-
86
-
87
-
88
-
89
-
90
-
91
-
92
-
93
-
94
-
95
-
96
-
97
-
98
-
99
-
100
-
101
-
102
-
103
-
104
-
105
-
106
-
107
-
108
-
109
-
110
-
111
-
 112
112 -
 113
113 -
 114
114 -
 115
115 -
 116
116 -
 117
117 -
 118
118 -
 119
119 -
 120
120 -
 121
121 -
 122
122 -
 123
123 -
 124
124 -
 125
125 -
 126
126 -
 127
127 -
 128
128 -
 129
129 -
 130
130 -
 131
131 -
 132
132 -
133
-
134
-
135
-
136
-
137
-
138
-
139
-
140
-
141
-
142
 |
 |

118 Tesco PLC Annual Report and Financial Statements 2013
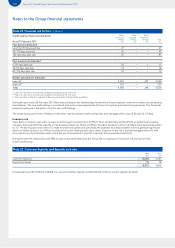
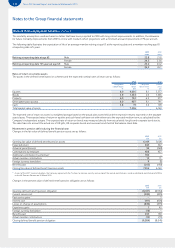
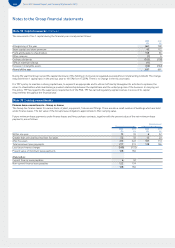
Note 26 Post-employment benefits continued
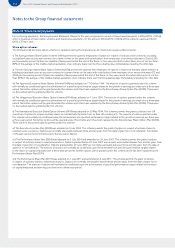
The mortality assumptions used are based on tables that have been projected to 2009 with long cohort improvements. In addition, the allowance
for future mortality improvements from 2009 is in line with medium cohort projections with a minimum annual improvement of 1% per annum.
The following table illustrates the expectation of life of an average member retiring at age 65 at the reporting date and a member reaching age 65
at reporting date +25 years.
2013
years
2012
years
Retiring at reporting date at age 65: Male 22.8 21.8
Female 24.3 23.6
Retiring at reporting date +25 years at age 65: Male 25.2 24.2
Female 26.5 26.1
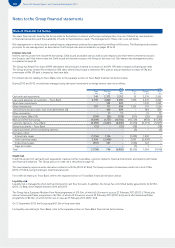
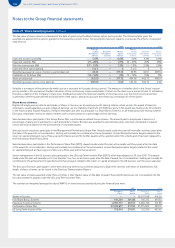
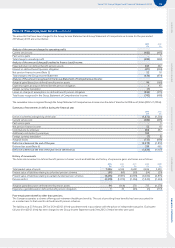
Rates of return on scheme assets
The assets in the defined benefit pension schemes and the expected nominal rates of return are as follows:
2013 2012
Long-term
rate of return
%
Market
value
£m
Long-term
rate of return
%
Market
value
£m
Equities 8.0 4,005 8.1 3,377
Bonds 3.9 1,533 4.9 1,365
Property 6.0 742 6.5 577
Other (alternative assets) 8.0 907 8.1 741
Cash 3.8 19 3.6 109
Total market value of assets 7,206 6,169
The expected rate of return on assets is a weighted average based on the actual plan assets held and the respective returns expected on the separate
asset classes. The expected rates of return on equities and cash have both been set with reference to the expected medium term, as calculated by the
Company’s independent actuary. The expected rate of return on bonds was measured directly from actual yields for gilts and corporate bond stocks.
The rates take into account the actual mix of UK gilts, UK corporate bonds and overseas bonds held at the balance sheet date.
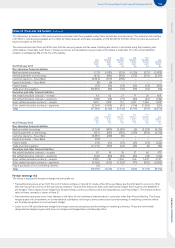
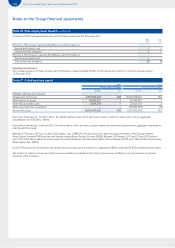
Movement in pension deficit during the financial year
Changes in the fair value of defined benefit pension assets are as follows:
2013
£m
2012
£m
Opening fair value of defined benefit pension assets 6,169 5,608
Expected return 463 422
Actuarial gains/(losses) 94 (168)
Contributions by employer 486 457
Additional contribution by employer*180 –
Actual member contributions 10 11
Foreign currency translation 9(1)
Benefits paid (205) (160)
Closing fair value of defined benefit pension assets 7,206 6,169
* As part of the 2011 triennial valuation, the Company agreed with the Trustees to increase security and, on top of the normal contributions, made an additional contribution of £180m
to the UK Pension Scheme on 30 March 2012.
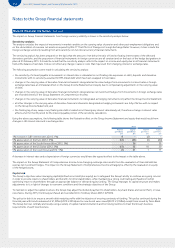
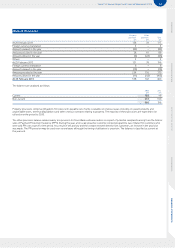
Changes in the present value of defined benefit pension obligation are as follows:
2013
£m
2012
£m
Opening defined benefit pension obligation (8,041) (6,964)
Current service cost (482) (495)
Past service gains – 3
Interest cost (411) (404)
Losses on change of assumptions (830) (373)
Experience gains 1 43
Foreign currency translation (16) –
Benefits paid 205 160
Actual member contributions (10) (11)
Closing defined benefit pension obligation (9,584) (8,041)
Notes to the Group financial statements