Tesco 2013 Annual Report Download - page 22
Download and view the complete annual report
Please find page 22 of the 2013 Tesco annual report below. You can navigate through the pages in the report by either clicking on the pages listed below, or by using the keyword search tool below to find specific information within the annual report.-
 1
1 -
2
-
3
-
4
-
5
-
6
-
7
-
8
-
9
-
10
-
11
-
 12
12 -
 13
13 -
 14
14 -
 15
15 -
 16
16 -
 17
17 -
 18
18 -
 19
19 -
 20
20 -
 21
21 -
 22
22 -
 23
23 -
 24
24 -
 25
25 -
 26
26 -
 27
27 -
 28
28 -
 29
29 -
 30
30 -
 31
31 -
 32
32 -
33
-
34
-
35
-
36
-
37
-
38
-
39
-
40
-
41
-
42
-
43
-
44
-
45
-
46
-
47
-
48
-
49
-
50
-
51
-
52
-
53
-
54
-
55
-
56
-
57
-
58
-
59
-
60
-
61
-
62
-
63
-
64
-
65
-
66
-
67
-
68
-
69
-
70
-
71
-
72
-
73
-
74
-
75
-
76
-
77
-
78
-
79
-
80
-
81
-
82
-
83
-
84
-
85
-
86
-
87
-
88
-
89
-
90
-
91
-
92
-
93
-
94
-
95
-
96
-
97
-
98
-
99
-
100
-
101
-
102
-
103
-
104
-
105
-
106
-
107
-
108
-
109
-
110
-
111
-
112
-
113
-
114
-
115
-
116
-
117
-
118
-
119
-
120
-
121
-
122
-
123
-
124
-
125
-
126
-
127
-
128
-
129
-
130
-
131
-
132
-
133
-
134
-
135
-
136
-
137
-
138
-
139
-
140
-
141
-
142
 |
 |

18 Tesco PLC Annual Report and Financial Statements 2013
Key performance indicators continued
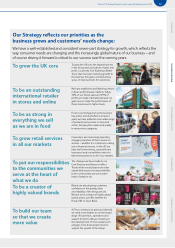
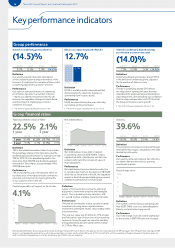
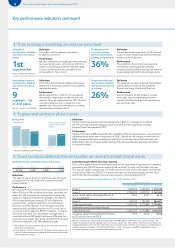
3. To be as strong in everything we sell as we are in food
UK general
merchandise, clothing
and electricals range
image
1st
supermarket
Source: Marketing Sciences.
Definition
Our relative position among competitors,
as rated by customers.
Performance
We have maintained our leading position amongst
our supermarket peers, reflecting our efforts to
create a compelling general merchandise range
in-store, combined with the strengths of our
online platform, Tesco Direct.
Proportion of UK
customers buying
general merchandise,
clothing and electricals
36%
Definition
The average weekly proportion of UK Clubcard
customers who bought a general merchandise,
clothing or electricals item.
Performance
The proportion of customers buying general
merchandise, clothing and electricals has
remained broadly similar to last year. We continue
to see subdued demand for discretionary items.
International general
merchandise, clothing
and electricals range
image
9
markets – 1st
or 2nd place
Source: Country image tracker.
Definition
The number of international markets where we are
ranked first or second by customers for our general
merchandise range.
Performance
We are ranked first, or joint first, for our general
merchandise range image in eight of these nine
markets. This is an improvement on 2011/12 when
customers ranked us first, or equal first, in six
markets, and reflects the strength of our clothing
and general merchandise offers.
Proportion of general
merchandise, clothing
and electricals sourced
as a Group
26%
Definition
The proportion, by sales, of general merchandise,
clothing and electricals we buy together,
through our Group Commercial function.
Performance
Our performance on this measure is similar
to last year, despite challenging economic
conditions holding back general merchandise
and electricals sales.
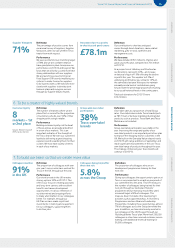
4. To grow retail services in all our markets
Bank profit
10/11 11/12
£264m
£225m*
12/13
£191m
Trading profit
* Re-presented to exclude PPI provision.
11/12 12/13
£140m £158m
Profit excluding legacy
income and fair value
releases
Definition
Trading profit measures the profit generated by Tesco Bank in its operations. It excludes
the one-off impact of an increasing provision for customer redress payments including
Payment Protection Insurance (‘PPI’).
Performance
Trading profit fell by (15)% impacted by the unwinding of the fair value provision – an accounting
adjustment made at the time of acquisition in 2008 – and the run-off in legacy income from the
Bank’s insurance distribution arrangement with Direct Line Group, which terminated last year.
Before these items, profits grew well and are up 13%, with a particularly pleasing performance
in customer lending.
5. To put our responsibilities to the communities we serve at the heart of what we do
Reduction in CO2e emissions from existing stores
09/10 10/11 11/12 12/13
8.5%†4.6%†3.9%†4.9%
Definition
The year-on-year reduction in greenhouse gas emissions
per square foot of sales area from existing stores built
before 2006/07.
Performance
We reduced the CO2e emissions from our stores built before
March 2006 by 4.9% compared to last year, exceeding our
target of 3.5%, helped by our continued focus across the
Group on reducing refrigerant gas leakage. Last year, this
KPI included distribution centres (‘DCs’) in addition to
existing stores∆. Using this definition, our performance
this year is a 4.5% reduction. From next year, we will be
measuring the cumulative reduction in CO2e across all of
our stores and DCs against a 2006/07 baseline – no matter
when they were built. This will simplify our target and is
consistent with our 2020 goal to achieve a 50% reduction
in emissions per square foot. At the end of 2012/13, we had
achieved a reduction of 32.5% towards this goal.
† These figures have been restated to exclude emissions from existing DCs
and from our US operations.
∆ This change was set out in the 2011/12 CR report and the previous year’s
figures are adjusted accordingly. Additional information can be found at
www.tescoplc.com/society.
Greenhouse gas (‘GHG’) emission reporting
This is a new addition to our Annual Report ahead of the upcoming UK legislation on mandatory
greenhouse gas (‘GHG’) emission reporting that we expect to come into force later this year.
This year our carbon footprint was 5.75 million tonnes of CO2e. Our overall carbon intensity has
decreased by 30% since 2006/07. For more information on our carbon targets, see the Tesco
and Society Report, available online at www.tescoplc.com/society/report2013.
GHG emissions data for period 25 February 2012 to 23 February 2013
Global tonnes of CO2e
Base year 2006/07 2011/12 2012/13
Scope 1 1,390,756 1,465,494 1,418,798
Scope 2 2,790,259 3,587,747 3,764,068
Scope 1 and 2 carbon intensity (kg CO2e/sq ft
of stores and DCs)
51.6 6 36.47 35.12
Scope 3 320,510 524,639 566,941
Total gross emissions 4,501,525 5, 577,8 80 5,749,807
Renewable energy exported to the grid – – 829
Total net emissions 4,501,525 5, 577,8 80 5,748,978
Overall net carbon intensity (total net emissions
kg CO2e/sq ft of stores and DCs)
55.62 40.25 38.96
We have calculated our carbon footprint according to the WRI/WBCSD Greenhouse Gas (‘GHG’) Protocol. We
follow the operational control approach and use emission factors from Defra/DECC’s GHG Conversion Factors for
Company Reporting 2012. For more information on our carbon targets and how we calculate our carbon footprint,
including reporting standards, the definition of Scope 1, 2 and 3 emissions, and ERM’s independent carbon
assurance statement, see www.tescoplc.com/society/resources.