Tesco 2013 Annual Report Download - page 25
Download and view the complete annual report
Please find page 25 of the 2013 Tesco annual report below. You can navigate through the pages in the report by either clicking on the pages listed below, or by using the keyword search tool below to find specific information within the annual report.-
 1
1 -
2
-
3
-
4
-
5
-
6
-
7
-
8
-
9
-
10
-
11
-
12
-
13
-
14
-
 15
15 -
 16
16 -
 17
17 -
 18
18 -
 19
19 -
 20
20 -
 21
21 -
 22
22 -
 23
23 -
 24
24 -
 25
25 -
 26
26 -
 27
27 -
 28
28 -
 29
29 -
 30
30 -
 31
31 -
 32
32 -
 33
33 -
 34
34 -
 35
35 -
36
-
37
-
38
-
39
-
40
-
41
-
42
-
43
-
44
-
45
-
46
-
47
-
48
-
49
-
50
-
51
-
52
-
53
-
54
-
55
-
56
-
57
-
58
-
59
-
60
-
61
-
62
-
63
-
64
-
65
-
66
-
67
-
68
-
69
-
70
-
71
-
72
-
73
-
74
-
75
-
76
-
77
-
78
-
79
-
80
-
81
-
82
-
83
-
84
-
85
-
86
-
87
-
88
-
89
-
90
-
91
-
92
-
93
-
94
-
95
-
96
-
97
-
98
-
99
-
100
-
101
-
102
-
103
-
104
-
105
-
106
-
107
-
108
-
109
-
110
-
111
-
112
-
113
-
114
-
115
-
116
-
117
-
118
-
119
-
120
-
121
-
122
-
123
-
124
-
125
-
126
-
127
-
128
-
129
-
130
-
131
-
132
-
133
-
134
-
135
-
136
-
137
-
138
-
139
-
140
-
141
-
142
 |
 |

21
Tesco PLC Annual Report and Financial Statements 2013
OVERVIEW BUSINESS REVIEW PERFORMANCE REVIEW GOVERNANCE FINANCIAL STATEMENTS
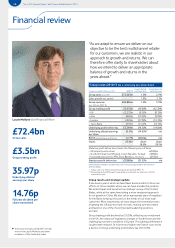
Group statutory profit before tax declined by (51.5)% to £1,960
million due to the impact of three main one-off charges:
• UK property write-down of £(804) million, following an in-depth
review of our property pipeline in the context of our fundamentally
different approach to new space and our announcement in April
2012 that we would be reducing the level of new space growth in
the UK going forward;
• Goodwill impairment of £(495) million, reflecting the impact
of differing growth prospects in today’s environment for the
businesses we acquired in Poland, the Czech Republic and Turkey
in the mid 1990s to early 2000s; and
• Increase of £(115) million in our provision for potential Payment
Protection Insurance claims against Tesco Bank.
Based on our progress so far with our strategic review of Fresh &
Easy, we have confirmed that the outcome of the review will be
an exit from the United States. The results of our business there,
in addition to those of our business in Japan, have been classified
as discontinued operations in these results.
Segmental results
UK
It is a year since we unveiled our six-part plan to get the UK business
back on top form. The UK is absolutely fundamental to the success
of the Group, which is why this was our number one priority for the
year, and I’m pleased to say the plan is very much on track.
We have made the investment as planned and it has led to a clear
improvement in performance, both in absolute terms and relative to
the market. Total sales rose by 2.6% excluding petrol, and like-for-
like performance improved during the course of the year, with a
particularly encouraging result at Christmas.
UK results 2012/13
£m % growth
UK sales £48,216m 1.8%
UK revenue (exc. VAT, exc. impact of IFRIC 13) £43,579m 1.8%
UK revenue (exc. petrol, exc. VAT, exc. impact of IFRIC 13) 2.6%
UK trading profit £2,272m (8.3)%
Trading margin (trading profit/revenue) 5.21% (58)bp
When we laid out our plans last year, we described the impact of
the investment in terms of a rebasing of our trading margin to 5.2%
and the progress we have made in the UK has been achieved whilst
delivering a margin absolutely in line with these expectations.
The most important judge of progress is the customer and we
introduced a new way of measuring customer perceptions back
in July – our ‘customer viewpoint’. This measures real customer
feedback in all of our stores on a regular and frequent basis, across
12 aspects of their shopping trip. Pleasingly, every one of these
aspects improved throughout the second half of the year. This
underpins our confidence that the underlying improvement we
have seen in our trading performance is driven by the changes
we have made for customers.
While there are a number of drivers that could enable us to improve
overall UK margins, we believe the new base of 5.2% is appropriate
for the foreseeable future and any outperformance will be reinvested
in driving additional improvements in our customer offer.
Asia
Our Asia performance was in line with expectations and was
dominated by the South Korean regulatory changes concerning
trading hours. These changes held back headline numbers, and the
impact on trading profit was broadly in line with our £(100) million
guidance, with significant levels of Sunday store closures throughout
the second half and considerable uncertainty in the market about
exactly which stores would be closed and when, impacting operations
even when stores were able to open. Following the passing of the
legislation in January this year, the situation seems more certain,
with more consistent store closures expected on alternate Sundays.
As such, we expect the full-year effect of the regulations, combined
with the extension of 24-hour trading restrictions to between
midnight and 10am, to lead to an incremental impact of around
£(40) million in 2013/14.
Asia results* 2012/13
Actual rates Constant rates
£m % growth % growth
Asia sales £12,317m 5.9% 6.1%
Asia revenue
(exc. VAT, exc. impact of IFRIC 13)
£11,479m 6.0% 6.2%
Asia trading profit £661m (10.3)% (9.8)%
Trading margin (trading profit/revenue) 5.76% (105)bp (102)bp
* Exc. Japan.
In Thailand, like-for-like sales grew by 3.1% and we continued to
gain market share. We benefited from a strong opening programme,
including almost 300 Express stores and we launched our first
dotcom grocery operation in Bangkok in February.
We have adopted a more cautious stance in China. We still see
an excess amount of new space being opened in the market –
ahead of customer demand – and we have moderated our pace of
development accordingly, opening just 12 new stores this year and
closing five underperforming stores as part of our increased focus
on our three strongest regions.
Europe
Whilst our markets in Europe remain fundamentally attractive,
our performance this year was disappointing.
Clearly, we faced significant headwinds throughout the year, as
macroeconomic uncertainties continued to impact businesses.
This had a particularly marked impact on our general merchandise
businesses across the region, holding back our overall like-for-like
sales performance.
Europe results 2012/13
Actual rates Constant rates
£m % growth % growth
Europe sales £10,809m (4.9)% 2.1%
Europe revenue
(exc. VAT, exc. impact of IFRIC 13)
£9, 319m (5.5)% 1.4%
Europe trading profit £329m ( 37. 8)% (33.3)%
Trading margin (trading profit/revenue) 3.53% (183)bp (183)bp