Tesco 2013 Annual Report Download - page 113
Download and view the complete annual report
Please find page 113 of the 2013 Tesco annual report below. You can navigate through the pages in the report by either clicking on the pages listed below, or by using the keyword search tool below to find specific information within the annual report.-
 1
1 -
2
-
3
-
4
-
5
-
6
-
7
-
8
-
9
-
10
-
11
-
12
-
13
-
14
-
15
-
16
-
17
-
18
-
19
-
20
-
21
-
22
-
23
-
24
-
25
-
26
-
27
-
28
-
29
-
30
-
31
-
32
-
33
-
34
-
35
-
36
-
37
-
38
-
39
-
40
-
41
-
42
-
43
-
44
-
45
-
46
-
47
-
48
-
49
-
50
-
51
-
52
-
53
-
54
-
55
-
56
-
57
-
58
-
59
-
60
-
61
-
62
-
63
-
64
-
65
-
66
-
67
-
68
-
69
-
70
-
71
-
72
-
73
-
74
-
75
-
76
-
77
-
78
-
79
-
80
-
81
-
82
-
83
-
84
-
85
-
86
-
87
-
88
-
89
-
90
-
91
-
92
-
93
-
94
-
95
-
96
-
97
-
98
-
99
-
100
-
101
-
102
-
 103
103 -
 104
104 -
 105
105 -
 106
106 -
 107
107 -
 108
108 -
 109
109 -
 110
110 -
 111
111 -
 112
112 -
 113
113 -
 114
114 -
 115
115 -
 116
116 -
 117
117 -
 118
118 -
 119
119 -
 120
120 -
 121
121 -
 122
122 -
 123
123 -
124
-
125
-
126
-
127
-
128
-
129
-
130
-
131
-
132
-
133
-
134
-
135
-
136
-
137
-
138
-
139
-
140
-
141
-
142
 |
 |

109
Tesco PLC Annual Report and Financial Statements 2013
OVERVIEW BUSINESS REVIEW PERFORMANCE REVIEW GOVERNANCE FINANCIAL STATEMENTS
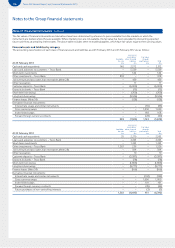
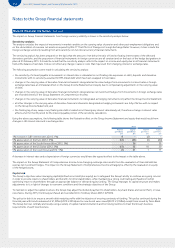
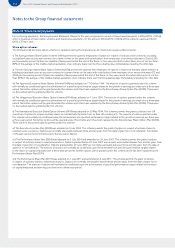
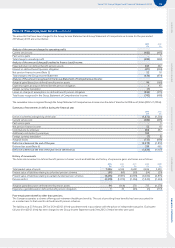
Note 22 Financial risk factors continued
The following is an analysis of the undiscounted contractual cash flows payable under financial liabilities and derivatives. The potential cash outflow
of £17.4bn is considered acceptable as it is offset by financial assets and trade receivables of £14.4bn (2012: £18.6bn offset by financial assets and
trade receivables of £14.3bn).
The undiscounted cash flows will differ from both the carrying values and fair value. Floating rate interest is estimated using the prevailing rate
at the balance sheet date. Cash flows in foreign currencies are translated using spot rates at the balance sheet date. For index-linked liabilities,
inflation is estimated at 3% for the life of the liability.
At 23 February 2013
Due
within
1 year
£m
Due
between
1 and 2
years
£m
Due
between
2 and 3
years
£m
Due
between
3 and 4
years
£m
Due
between
4 and 5
years
£m
Due
beyond
5 years
£m
Non-derivative financial liabilities
Bank and other borrowings (711) (1,081) (553) (1,550) (575) (5,805)
Interest payments on borrowings (451) (441) (402) (375) (301) ( 3, 511)
Customer deposits – Tesco Bank (5,323) (577) (100) – – –
Deposits by banks – Tesco Bank (9) (6) – – – –
Finance leases (13) (13) (13) (13) (13) (212)
Trade and other payables (10,865) (93) (31) (19) (12) ( 74)
Derivative and other financial liabilities
Net settled derivative contracts – receipts 63 62 27 71 20 608
Net settled derivative contracts – payments (106) (78) (71) (50) (47) (362)
Gross settled derivative contracts – receipts 3,610 1,588 157 1,057 1,369 1,008
Gross settled derivative contracts – payments (3,564) (1,485) (57) (916) (1,000) (531)
Total (17,369) (2,124) (1,043) (1,795) (559) (8,879)
At 25 February 2012
Due
within
1 year
£m
Due
between
1 and 2
years
£m
Due
between
2 and 3
years
£m
Due
between
3 and 4
years
£m
Due
between
4 and 5
years
£m
Due
beyond
5 years
£m
Non-derivative financial liabilities
Bank and other borrowings (1,734) (867) (1,005) (5) (1,524) (6,124)
Interest payments on borrowings (557) (431) (395) (359) (359) (3,716)
Customer deposits – Tesco Bank (5,087) (249) (51) – – –
Deposits by banks – Tesco Bank (78) – – – – –
Finance leases (39) (17) (15) (13) (13) (222)
Trade and other payables (11,011) (105) (22) (35) (9) (52)
Derivative and other financial liabilities
Net settled derivative contracts – receipts 67 54 56 21 60 470
Net settled derivative contracts – payments (122) (80) (69) (61) (43) (342)
Gross settled derivative contracts – receipts 3,905 735 1,416 166 1,047 3,757
Gross settled derivative contracts – payments (3,900) (652) (1,328) (77) (935) (2,685)
Future purchases of non-controlling interests (3) – – – – –
Total (18,559) (1,612) (1,413) (363) (1,776) (8,914)
Foreign exchange risk
The Group is exposed to foreign exchange risk principally via:
• Transactional exposure arises from the cost of future purchases of goods for resale, where those purchases are denominated in a currency other
than the functional currency of the purchasing company. Transactional exposures that could significantly impact the Group Income Statement
are hedged. These exposures are hedged via forward foreign currency contracts which are designated as cash flow hedges. The notional and fair
value of these contracts is shown in Note 21.
• Net investment exposure arises from changes in the value of net investments denominated in currencies other than Pounds Sterling. The Group
hedges a part of its investments in its international subsidiaries via foreign currency transactions and borrowings in matching currencies which
are formally designated as net investment hedges.
• Loans to non-UK subsidiaries are hedged via foreign currency transactions and borrowings in matching currencies. These are not formally
designated as hedges as gains and losses on hedges and hedged loans will naturally offset.