Singapore Airlines 2004 Annual Report Download - page 78
Download and view the complete annual report
Please find page 78 of the 2004 Singapore Airlines annual report below. You can navigate through the pages in the report by either clicking on the pages listed below, or by using the keyword search tool below to find specific information within the annual report.-
 1
1 -
2
-
3
-
4
-
5
-
6
-
7
-
8
-
9
-
10
-
11
-
12
-
13
-
14
-
15
-
16
-
17
-
18
-
19
-
20
-
21
-
22
-
23
-
24
-
25
-
26
-
27
-
28
-
29
-
30
-
31
-
32
-
33
-
34
-
35
-
36
-
37
-
38
-
39
-
40
-
41
-
42
-
43
-
44
-
45
-
46
-
47
-
48
-
49
-
50
-
51
-
52
-
53
-
54
-
55
-
56
-
57
-
58
-
59
-
60
-
61
-
62
-
63
-
64
-
65
-
66
-
67
-
 68
68 -
 69
69 -
 70
70 -
 71
71 -
 72
72 -
 73
73 -
 74
74 -
 75
75 -
 76
76 -
 77
77 -
 78
78 -
 79
79 -
 80
80 -
 81
81 -
 82
82 -
 83
83 -
 84
84 -
 85
85 -
 86
86 -
 87
87 -
 88
88 -
89
-
90
-
91
-
92
-
93
-
94
-
95
-
96
-
97
-
98
-
99
-
100
-
101
-
102
-
103
-
104
-
105
-
106
-
107
-
108
-
109
-
110
-
111
-
112
-
113
-
114
-
115
-
116
-
117
-
118
-
119
-
120
-
121
-
122
-
123
-
124
-
125
-
126
-
127
-
128
-
129
-
130
-
131
-
132
 |
 |

Notes to the Financial Statements
31 March 2004
76 SIA Annual Report 03/04
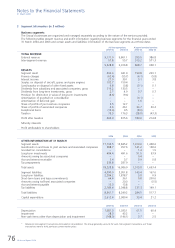
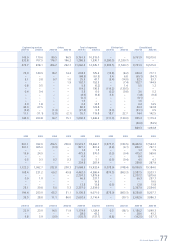
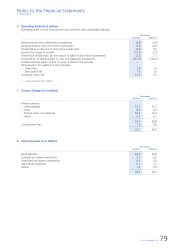
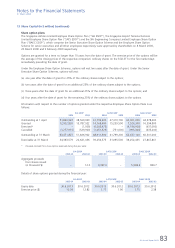
3 Segment Information (in $ million)
Business segments
The Group’s businesses are organized and managed separately according to the nature of the services provided.
The following tables present revenue and profit information regarding business segments for the financial years ended
31 March 2004 and 2003 and certain assets and liabilities information of the business segments as at those dates.
Airline operations Airport terminal services
2003-04 2002-03 2003-04 2002-03
–––––––––––––––––––––––––––––––––––––––––––––––––––––––––––––––––––––––––––––––––––––––––––––––––––––––––––––––––––––––––––––––––––––––––––––––––––––––––––––––––––––––––––
TOTAL REVENUE
External revenue 9,171.0 9,861.1 355.5 386.8
Inter-segment revenue 57.8 55.7 513.2 571.3
–––––––––––––––––––––––––––––––––––––––––––––––––––––––––––––––––––––––––––––––
9,228.8 9,916.8 868.7 958.1
–––––––––––––––––––––––––––––––––––––––––––––––––––––––––––––––––––––––––––––––
RESULTS
Segment result 406.3 341.0 190.8 229.1
Finance charges (62.4) (55.7) (6.1) (5.8)
Interest income 27.0 39.1 5.1 3.8
Surplus on disposal of aircraft, spares and spare engines 102.7 150.4 – –
(Loss)/surplus on disposal of other fixed assets 4.8 (0.8) (0.1) 0.1
Dividends from subsidiary and associated companies, gross 119.2 130.5 – –
Dividends from long-term investments, gross 2.7 4.9 0.7 0.7
Provision for diminution in value of long-term investments (8.6) (9.4) – –
Amortization of goodwill on consolidation – – (0.1) –
Amortization of deferred gain – – 1.6 –
Share of profits of joint venture companies 3.5 12.7 – –
Share of profits of associated companies 6.6 26.1 33.7 30.2
Exceptional items (15.3) 0.5 (8.0) –
Taxation 75.5 176.3 (28.0) (43.3)
–––––––––––––––––––––––––––––––––––––––––––––––––––––––––––––––––––––––––––––––
Profit after taxation 662.0 815.6 189.6 214.8
––––––––––––––––––––––––––––––––––––––––––––––––––––––––––––––––––––––––––––––––
Minority interests
Profit attributable to shareholders
–––––––––––––––––––––––––––––––––––––––––––––––––––––––––––––––––––––––––––––––––––––––––––––––––––––––––––––––––––––––––––––––––––––––––––––––––––––––––––––––––––––––––––
2004 2003 2004 2003
–––––––––––––––––––––––––––––––––––––––––––––––––––––––––––––––––––––––––––––––––––––––––––––––––––––––––––––––––––––––––––––––––––––––––––––––––––––––––––––––––––––––––––
OTHER INFORMATION AT 31 MARCH
Segment assets 17,192.5 15,845.2 1,319.6 1,458.6
Investments in and loans to joint venture and associated companies 388.7 357.6 141.2 138.6
Goodwill on consolidation – – 1.4 1.5
Long-term investments 404.4 491.6 51.5 53.9
Amounts owing by associated companies – – 0.4 –
Accrued interest receivable 3.4 3.7 0.9 0.8
Tax prepayments 239.8 287.9 – –
–––––––––––––––––––––––––––––––––––––––––––––––––––––––––––––––––––––––––––––––
Total assets 18,228.8 16,986.0 1,515.0 1,653.4
–––––––––––––––––––––––––––––––––––––––––––––––––––––––––––––––––––––––––––––––
Segment liabilities 4,090.0 3,951.8 143.4 167.6
Long-term liabilities 2,204.2 1,878.7 3.0 0.9
Short-term loans and lease commitments 64.6 36.1 0.8 200.6
Amounts owing to/(from) associated companies – 20.0 – (0.5)
Accrued interest payable 13.3 13.8 – –
Tax liabilities 2,189.6 2,348.8 137.3 149.1
–––––––––––––––––––––––––––––––––––––––––––––––––––––––––––––––––––––––––––––––
Total liabilities 8,561.7 8,249.2 284.5 517.7
–––––––––––––––––––––––––––––––––––––––––––––––––––––––––––––––––––––––––––––––
Capital expenditure 2,612.6 2,980.4 33.4 21.2
–––––––––––––––––––––––––––––––––––––––––––––––––––––––––––––––––––––––––––––––––––––––––––––––––––––––––––––––––––––––––––––––––––––––––––––––––––––––––––––––––––––––––––
2003-04 2002-03 2003-04 2002-03
–––––––––––––––––––––––––––––––––––––––––––––––––––––––––––––––––––––––––––––––––––––––––––––––––––––––––––––––––––––––––––––––––––––––––––––––––––––––––––––––––––––––––––
Depreciation 1,081.0 1,033.1 61.5 60.4
Impairment 28.0 43.2 – –
Non-cash items other than depreciation and impairment (148.3) (146.1) 3.7 2.5
–––––––––––––––––––––––––––––––––––––––––––––––––––––––––––––––––––––––––––––––––––––––––––––––––––––––––––––––––––––––––––––––––––––––––––––––––––––––––––––––––––––––––––
* Relates to inter-segment transactions eliminated on consolidation. The Group generally accounts for such inter-segment transactions as if these
transactions were to third parties at current market prices.