Singapore Airlines 2004 Annual Report Download - page 70
Download and view the complete annual report
Please find page 70 of the 2004 Singapore Airlines annual report below. You can navigate through the pages in the report by either clicking on the pages listed below, or by using the keyword search tool below to find specific information within the annual report.-
 1
1 -
2
-
3
-
4
-
5
-
6
-
7
-
8
-
9
-
10
-
11
-
12
-
13
-
14
-
15
-
16
-
17
-
18
-
19
-
20
-
21
-
22
-
23
-
24
-
25
-
26
-
27
-
28
-
29
-
30
-
31
-
32
-
33
-
34
-
35
-
36
-
37
-
38
-
39
-
40
-
41
-
42
-
43
-
44
-
45
-
46
-
47
-
48
-
49
-
50
-
51
-
52
-
53
-
54
-
55
-
56
-
57
-
58
-
59
-
 60
60 -
 61
61 -
 62
62 -
 63
63 -
 64
64 -
 65
65 -
 66
66 -
 67
67 -
 68
68 -
 69
69 -
 70
70 -
 71
71 -
 72
72 -
 73
73 -
 74
74 -
 75
75 -
 76
76 -
 77
77 -
 78
78 -
 79
79 -
 80
80 -
81
-
82
-
83
-
84
-
85
-
86
-
87
-
88
-
89
-
90
-
91
-
92
-
93
-
94
-
95
-
96
-
97
-
98
-
99
-
100
-
101
-
102
-
103
-
104
-
105
-
106
-
107
-
108
-
109
-
110
-
111
-
112
-
113
-
114
-
115
-
116
-
117
-
118
-
119
-
120
-
121
-
122
-
123
-
124
-
125
-
126
-
127
-
128
-
129
-
130
-
131
-
132
 |
 |

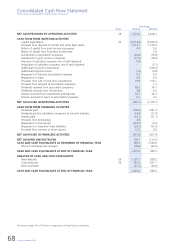
68 SIA Annual Report 03/04
Consolidated Cash Flow Statement
For the financial year ended 31 March 2004 (in $ million)
The Group
Notes 2003-04 2002-03
––––––––––––––––––––––––––––––––––––––––––––––––––––––––––––––––––––––––––––––––––––––––––––––––––––––––––––––––––––––––––––––––––––––––––––––––––––––––––
NET CASH PROVIDED BY OPERATING ACTIVITIES 29 1,716.4 1,818.1
––––––––––––––––––––––––––––––––
CASH FLOW FROM INVESTING ACTIVITIES
Capital expenditure 30 (2,214.2) (3,039.3)
Proceeds from disposal of aircraft and other fixed assets 1,513.7 1,279.5
Return of capital from joint venture companies 0.9 0.9
Return of capital from long-term investments – 2.8
Investments in associated companies (24.6) (16.8)
Investments in joint venture companies (21.5) (18.9)
Disposal of subsidiary company, net of cash disposed (1.4) –
Acquisition of subsidiary company, net of cash acquired – (2.1)
Additional long-term investments – (169.6)
Additional long-term loans (1.4) (0.8)
Repayment of loans by associated companies 5.5 6.0
Repayment of loans 6.4 6.3
Proceeds from sale of long-term investments 76.8 154.1
Proceeds from disposal of associated companies – 1.0
Dividends received from associated companies 60.5 36.1
Dividends received from investments 3.8 4.5
Interest received from investments and deposits 32.7 32.3
Interest received on loans to associated companies 0.1 0.3
––––––––––––––––––––––––––––––––
NET CASH USED IN INVESTING ACTIVITIES (562.7) (1,723.7)
––––––––––––––––––––––––––––––––
CASH FLOW FROM FINANCING ACTIVITIES
Dividends paid (109.6) (181.7)
Dividends paid by subsidiary companies to minority interests (14.4) (17.9)
Interest paid (62.1) (51.1)
Proceeds from borrowings 2.8 –
Repayment of borrowings (224.7) (0.2)
Repayment of long-term lease liabilities (20.3) (57.9)
Proceeds from exercise of share options 15.3 0.9
––––––––––––––––––––––––––––––––
NET CASH USED IN FINANCING ACTIVITIES (413.0) (307.9)
––––––––––––––––––––––––––––––––
NET CASH INFLOW/(OUTFLOW) 740.7 (213.5)
CASH AND CASH EQUIVALENTS AT BEGINNING OF FINANCIAL YEAR 789.3 1,034.8
Effect of exchange rate changes (38.6) (32.0)
––––––––––––––––––––––––––––––––
CASH AND CASH EQUIVALENTS AT END OF FINANCIAL YEAR 1,491.4 789.3
––––––––––––––––––––––––––––––––
ANALYSIS OF CASH AND CASH EQUIVALENTS
Fixed deposits 26 1,137.1 528.2
Cash and bank 26 381.4 291.7
Bank overdrafts (27.1) (30.6)
––––––––––––––––––––––––––––––––
CASH AND CASH EQUIVALENTS AT END OF FINANCIAL YEAR 1,491.4 789.3
––––––––––––––––––––––––––––––––
The notes on pages 70 to 107 form an integral part of these financial statements.