Singapore Airlines 2004 Annual Report Download - page 56
Download and view the complete annual report
Please find page 56 of the 2004 Singapore Airlines annual report below. You can navigate through the pages in the report by either clicking on the pages listed below, or by using the keyword search tool below to find specific information within the annual report.-
 1
1 -
2
-
3
-
4
-
5
-
6
-
7
-
8
-
9
-
10
-
11
-
12
-
13
-
14
-
15
-
16
-
17
-
18
-
19
-
20
-
21
-
22
-
23
-
24
-
25
-
26
-
27
-
28
-
29
-
30
-
31
-
32
-
33
-
34
-
35
-
36
-
37
-
38
-
39
-
40
-
41
-
42
-
43
-
44
-
45
-
 46
46 -
 47
47 -
 48
48 -
 49
49 -
 50
50 -
 51
51 -
 52
52 -
 53
53 -
 54
54 -
 55
55 -
 56
56 -
 57
57 -
 58
58 -
 59
59 -
 60
60 -
 61
61 -
 62
62 -
 63
63 -
 64
64 -
 65
65 -
 66
66 -
67
-
68
-
69
-
70
-
71
-
72
-
73
-
74
-
75
-
76
-
77
-
78
-
79
-
80
-
81
-
82
-
83
-
84
-
85
-
86
-
87
-
88
-
89
-
90
-
91
-
92
-
93
-
94
-
95
-
96
-
97
-
98
-
99
-
100
-
101
-
102
-
103
-
104
-
105
-
106
-
107
-
108
-
109
-
110
-
111
-
112
-
113
-
114
-
115
-
116
-
117
-
118
-
119
-
120
-
121
-
122
-
123
-
124
-
125
-
126
-
127
-
128
-
129
-
130
-
131
-
132
 |
 |

54 SIA Annual Report 03/04
Financial Review
Performance of the Company (continued)
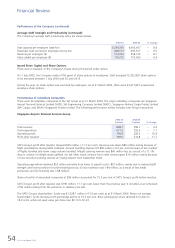
Average Staff Strength and Productivity (continued)
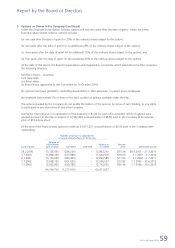
The Company’s average staff productivity ratios are shown below:
2003-04 2002-03 % Change
––––––––––––––––––––––––––––––––––––––––––––––––––––––––––––––––––––––––––––––––––––––––––––––––––––––––––––––––––––––––––––––––––––––––––––––––––––––––
Seat capacity per employee (seat-km) 6,299,265 6,905,667 – 8.8
Passenger load carried per employee (tonne-km) 448,513 495,617 – 9.5
Revenue per employee ($) 513,034 558,122 – 8.1
Value added per employee ($) 179,272 191,566 – 6.4
––––––––––––––––––––––––––––––––––––––––––––––––––––––––––––––––––––––––––––––––––––––––––––––––––––––––––––––––––––––––––––––––––––––––––––––––––––––––
Issued Share Capital and Share Options
There was no buyback of the Company’s shares during the period under review.
On 1 July 2003, the Company made a fifth grant of share options to employees. Staff accepted 12,922,820 share options
to be exercised between 1 July 2004 and 30 June 2013.
During the year, no share option was exercised by employees. As at 31 March 2004, there were 63,471,827 unexercised
employee share options.
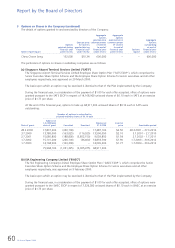
Performance of Subsidiary Companies
There were 24 subsidiary companies in the SIA Group as at 31 March 2004. The major subsidiary companies are Singapore
Airport Terminal Services Limited (SATS), SIA Engineering Company Limited (SIAEC), Singapore Airlines Cargo Private Limited
(SIA Cargo), and SilkAir (Singapore) Private Limited. The following performance review includes inter-Group transactions.
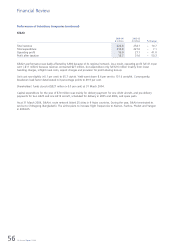
Singapore Airport Terminal Services Group
2003-04 2002-03
$ million $ million % Change
––––––––––––––––––––––––––––––––––––––––––––––––––––––––––––––––––––––––––––––––––––––––––––––––––––––––––––––––––––––––––––––––––––––––––––––––––––––––
Total revenue 868.7 958.1 – 9.3
Total expenditure 677.9 729.9 – 7.1
Operating profit 190.8 228.2 – 16.4
Profit after taxation 189.6 214.8 – 11.7
––––––––––––––––––––––––––––––––––––––––––––––––––––––––––––––––––––––––––––––––––––––––––––––––––––––––––––––––––––––––––––––––––––––––––––––––––––––––
SATS Group’s profit after taxation dropped $25 million (–11.7 per cent). Revenue was down $89 million mainly because of
flight cancellations during SARS outbreak. Ground handling revenue fell $45 million (–9.9 per cent) because of less number
of flights handled and lower cargo volume handled. Inflight catering revenue was $60 million less as a result of a 11.1%
drop in volume of inflight meals uplifted. On the other hand, revenue from other services grew $16 million mainly because
of new security screening services at Changi Airport from September 2003.
Operating expenditure declined $52 million primarily from lower (i) payroll costs (–$37 million, mainly due to reduced staff
strength and lower provision for profit-sharing bonus); (ii) raw material costs (–$4 million, as a result of less meals
produced); and (iii) licensing fees (–$8 million).
Share of profits of associated companies at $34 million accounted for 15.5 per cent of SATS Group’s profit before taxation.
SATS Group’s profit after taxation was $190 million, 11.7 per cent lower than the previous year. It included a tax write-back
of $9 million arising from the reduction in statutory tax rate.
The SATS Group’s shareholders’ funds was $1,228.1 million (+13.0 per cent) as at 31 March 2004. Return on average
shareholders’ funds decreased 4.9 percentage points to 16.4 per cent. Basic earnings per share declined 2.6 cents to
18.9 cents, while net asset value per share rose $0.13 to $1.22.