Singapore Airlines 2004 Annual Report Download - page 103
Download and view the complete annual report
Please find page 103 of the 2004 Singapore Airlines annual report below. You can navigate through the pages in the report by either clicking on the pages listed below, or by using the keyword search tool below to find specific information within the annual report.-
 1
1 -
2
-
3
-
4
-
5
-
6
-
7
-
8
-
9
-
10
-
11
-
12
-
13
-
14
-
15
-
16
-
17
-
18
-
19
-
20
-
21
-
22
-
23
-
24
-
25
-
26
-
27
-
28
-
29
-
30
-
31
-
32
-
33
-
34
-
35
-
36
-
37
-
38
-
39
-
40
-
41
-
42
-
43
-
44
-
45
-
46
-
47
-
48
-
49
-
50
-
51
-
52
-
53
-
54
-
55
-
56
-
57
-
58
-
59
-
60
-
61
-
62
-
63
-
64
-
65
-
66
-
67
-
68
-
69
-
70
-
71
-
72
-
73
-
74
-
75
-
76
-
77
-
78
-
79
-
80
-
81
-
82
-
83
-
84
-
85
-
86
-
87
-
88
-
89
-
90
-
91
-
92
-
 93
93 -
 94
94 -
 95
95 -
 96
96 -
 97
97 -
 98
98 -
 99
99 -
 100
100 -
 101
101 -
 102
102 -
 103
103 -
 104
104 -
 105
105 -
 106
106 -
 107
107 -
 108
108 -
 109
109 -
 110
110 -
 111
111 -
 112
112 -
 113
113 -
114
-
115
-
116
-
117
-
118
-
119
-
120
-
121
-
122
-
123
-
124
-
125
-
126
-
127
-
128
-
129
-
130
-
131
-
132
 |
 |

101
SIA Annual Report 03/04
Notes to the Financial Statements
31 March 2004
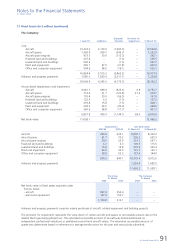
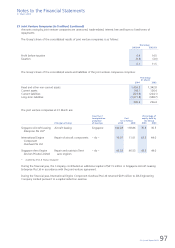
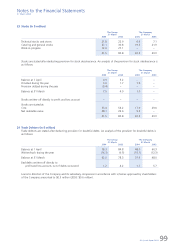
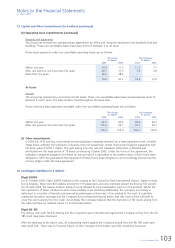
27 Trade Creditors (in $ million)
Included in trade creditors is provision for warranty claims. An analysis of provision for warranty claims is as follows:
The Group The Company
31 March 31 March
2004 2003 2004 2003
––––––––––––––––––––––––––––––––––––––––––––––––––––––––––––––––––––––––––––––––––––––––––––––––––––––––––––––––––––––––––––––––––––––––––––––––––––
Balance at 1 April 1.1 1.2 – –
Provided/(written-back) during the year 1.4 (0.1) – –
Provision utilized during the year (0.4) – – –
––––––––––––––––––––––––––––––––––––––––––––––––––––––––––––––––––––
2.1 1.1 – –
––––––––––––––––––––––––––––––––––––––––––––––––––––––––––––––––––––
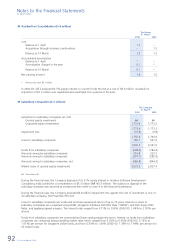
28 Bank Overdrafts (in $ million)
$2.3 million (2003: nil) of the Group’s bank overdrafts are secured by a first legal mortgage over a building at 22
Senoko Way Singapore 758095. Interest is charged at rates ranging from 3.50% to 3.75% per annum in the current
financial year.
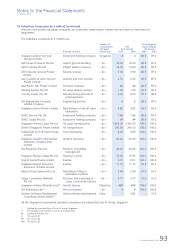
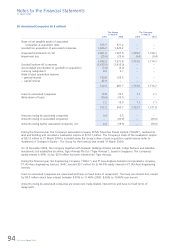
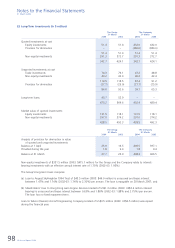
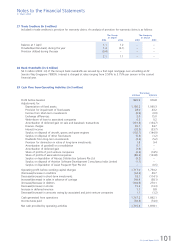
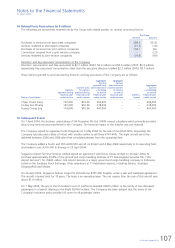
29 Cash Flow from Operating Activities (in $ million)
The Group
2003-04 2002-03
––––––––––––––––––––––––––––––––
Profit before taxation 820.9 976.8
Adjustments for:
Depreciation of fixed assets 1,180.2 1,090.3
Provision for impairment of fixed assets 28.0 43.2
Income from short-term investments (0.9) (0.9)
Exchange differences 2.0 15.0
Write-down of loan to associated companies 0.5 0.2
Amortization of deferred gain on sale and leaseback transactions (131.8) (134.7)
Finance charges 65.1 54.7
Interest income (32.5) (33.7)
Surplus on disposal of aircraft, spares and spare engines (102.7) (144.9)
Surplus on disposal of other fixed assets (5.5) (1.2)
Dividends from long-term investments (3.6) (5.2)
Provision for diminution in value of long-term investments 1.8 9.4
Amortization of goodwill on consolidation 0.1 –
Amortization of deferred gain (1.6) –
Share of profits of joint venture companies (6.4) (14.5)
Share of profits of associated companies (86.3) (123.8)
Surplus on liquidation of Abacus Distribution Systems Pte Ltd (9.2) –
Surplus on disposal of Aviation Software Development Consultancy India Limited (1.1) –
Surplus on liquidation of Asian Frequent Flyer Pte Ltd – (0.5)
––––––––––––––––––––––––––––––––
Operating profit before working capital changes 1,717.0 1,730.2
(Decrease)/increase in creditors (34.2) 49.7
Decrease/(increase) in short-term investments 18.1 (114.1)
Increase/(decrease) in sales in advance of carriage 149.4 (38.1)
(Increase)/decrease in debtors (104.6) 270.1
Decrease/(increase) in stocks 19.3 (13.3)
Increase in deferred revenue 1.1 8.8
Decrease/(increase) in amounts owing by associated and joint venture companies 1.1 (1.2)
––––––––––––––––––––––––––––––––
Cash generated from operations 1,767.2 1,892.1
Income taxes paid (50.8) (74.0)
––––––––––––––––––––––––––––––––
Net cash provided by operating activities 1,716.4 1,818.1
––––––––––––––––––––––––––––––––