Singapore Airlines 2004 Annual Report Download - page 53
Download and view the complete annual report
Please find page 53 of the 2004 Singapore Airlines annual report below. You can navigate through the pages in the report by either clicking on the pages listed below, or by using the keyword search tool below to find specific information within the annual report.-
 1
1 -
2
-
3
-
4
-
5
-
6
-
7
-
8
-
9
-
10
-
11
-
12
-
13
-
14
-
15
-
16
-
17
-
18
-
19
-
20
-
21
-
22
-
23
-
24
-
25
-
26
-
27
-
28
-
29
-
30
-
31
-
32
-
33
-
34
-
35
-
36
-
37
-
38
-
39
-
40
-
41
-
42
-
 43
43 -
 44
44 -
 45
45 -
 46
46 -
 47
47 -
 48
48 -
 49
49 -
 50
50 -
 51
51 -
 52
52 -
 53
53 -
 54
54 -
 55
55 -
 56
56 -
 57
57 -
 58
58 -
 59
59 -
 60
60 -
 61
61 -
 62
62 -
 63
63 -
64
-
65
-
66
-
67
-
68
-
69
-
70
-
71
-
72
-
73
-
74
-
75
-
76
-
77
-
78
-
79
-
80
-
81
-
82
-
83
-
84
-
85
-
86
-
87
-
88
-
89
-
90
-
91
-
92
-
93
-
94
-
95
-
96
-
97
-
98
-
99
-
100
-
101
-
102
-
103
-
104
-
105
-
106
-
107
-
108
-
109
-
110
-
111
-
112
-
113
-
114
-
115
-
116
-
117
-
118
-
119
-
120
-
121
-
122
-
123
-
124
-
125
-
126
-
127
-
128
-
129
-
130
-
131
-
132
 |
 |

51
SIA Annual Report 03/04
Financial Review
Performance of the Company (continued)
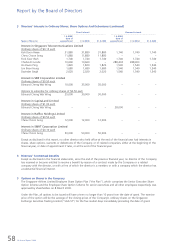
Expenditure
The Company’s expenditure for 2003-04 decreased 10.2 per cent from a year ago, to $7,037 million as follows:
2003-04 2002-03 Change
$ million % $ million % $ million %
–––––––––––––––––––––––––––––––––––––––––––––––––––––––––––––––––––––––––––––––––––––––––––––––––––––––––––––––––––––––––––––––––––––––––––––––––––––––––
Fuel costs 1,415.7 20.1 1,523.1 19.4 – 107.4 – 7.1
Staff costs 1,226.5 17.4 1,409.7 18.0 – 183.2 – 13.0
Depreciation 928.2 13.2 882.7 11.2 + 45.5 + 5.2
Aircraft maintenance and
overhaul costs 760.2 10.8 902.8 11.5 – 142.6 – 15.8
Handling charges 627.7 8.9 719.0 9.2 – 91.3 – 12.7
Sales costs R1 473.1 6.7 618.5 7.9 – 145.4 – 23.5
Inflight meals and other
passenger costs 453.0 6.5 521.5 6.7 – 68.5 – 13.1
Airport and overflying charges 408.9 5.8 478.6 6.1 – 69.7 – 14.6
Rentals on leased aircraft 310.9 4.4 303.1 3.9 + 7.8 + 2.6
Communication and information
technology costs R2 124.2 1.8 150.4 1.9 – 26.2 – 17.4
Other costs R3 309.0 4.4 328.6 4.2 – 19.6 – 6.0
––––––––––––––––––––––––––––––––––––––––––––––––––––––––––––––––––––––––––––––––––––––––––––––––––––––––
7,037.4 100.0 7,838.0 100.0 – 800.6 – 10.2
–––––––––––––––––––––––––––––––––––––––––––––––––––––––––––––––––––––––––––––––––––––––––––––––––––––––––––––––––––––––––––––––––––––––––––––––––––––––––
R1 Sales costs included commissions and incentives payable, frequent flyer programme costs, computer reservation system booking fees, advertising expenses
and other sales costs.
R2 Communication and information technology costs were for data transmission and contract service fees, hire of computer equipment, maintenance/rental
of software, and information technology contract and professional fees.
R3 Other costs mainly comprised crew expenses, company accommodation costs, exchange loss, comprehensive aviation insurance costs, airport lounge
expenses, non-information technology contract and professional fees, expenses incurred to mount non-scheduled services, aircraft licence fees and
recoveries.
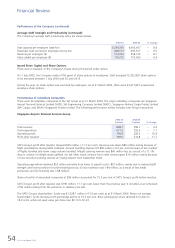
Expenditure on fuel was $107 million lower because of:
$ million
–––––––––––––––––––––––––––––––––––––––––––––––––––––––––––––––––––––––––––––––––––––––––––––––––––––––––––––––––––––––––––––––––––––––––––––––––––––––––
12.9% decrease in volume uplifted from 1,077.24 M AG to 938.29 M AG – 203
9.8% increase in weighted average fuel price from 82.16 US¢/AG to 90.25 US¢/AG + 135
2.6% weakening of USD against SGD from US$1=S$1.775 to US$1=S$1.728 – 40
––––––––––––––––
– 108
Lower hedging gain +1
––––––––––––––––
– 107
–––––––––––––––––––––––––––––––––––––––––––––––––––––––––––––––––––––––––––––––––––––––––––––––––––––––––––––––––––––––––––––––––––––––––––––––––––––––––
Staff costs fell $183 million mainly due to (i) lower provision for profit-sharing bonus this year (2.05 months’ salary versus
3.23 months’ salary last year); (ii) lower average staff strength (–408 staff); and (iii) reduction in employer’s CPF rate from
16 per cent to 13 per cent from October 2003.
Depreciation charges increased $46 million mainly due to (i) the commissioning of five B777-200A, one B777-200, one
B777-200ER and three A340-500 aircraft during the year; and (ii) the full year’s impact of eight B777-200ER, two B777-200,
one B777-200A and one B777-300 aircraft commissioned in the previous year. The increase was partially offset by (i) the
full year’s impact of trade-in of five A340-300 aircraft and two A310-300 aircraft, sale of two A310-300 aircraft and sale
and leaseback of one B747-400 aircraft last year; and (ii) trade-in of three A340-300, four A310-300 and two B747-400
aircraft and sale and leaseback of one B747-400 and one B777-300 aircraft during the year.
Aircraft maintenance and overhaul (AMO) costs fell $143 million. The reduction in maintenance activities was partly due to
the cutback in flying operations.