Singapore Airlines 2004 Annual Report Download - page 113
Download and view the complete annual report
Please find page 113 of the 2004 Singapore Airlines annual report below. You can navigate through the pages in the report by either clicking on the pages listed below, or by using the keyword search tool below to find specific information within the annual report.-
 1
1 -
2
-
3
-
4
-
5
-
6
-
7
-
8
-
9
-
10
-
11
-
12
-
13
-
14
-
15
-
16
-
17
-
18
-
19
-
20
-
21
-
22
-
23
-
24
-
25
-
26
-
27
-
28
-
29
-
30
-
31
-
32
-
33
-
34
-
35
-
36
-
37
-
38
-
39
-
40
-
41
-
42
-
43
-
44
-
45
-
46
-
47
-
48
-
49
-
50
-
51
-
52
-
53
-
54
-
55
-
56
-
57
-
58
-
59
-
60
-
61
-
62
-
63
-
64
-
65
-
66
-
67
-
68
-
69
-
70
-
71
-
72
-
73
-
74
-
75
-
76
-
77
-
78
-
79
-
80
-
81
-
82
-
83
-
84
-
85
-
86
-
87
-
88
-
89
-
90
-
91
-
92
-
93
-
94
-
95
-
96
-
97
-
98
-
99
-
100
-
101
-
102
-
 103
103 -
 104
104 -
 105
105 -
 106
106 -
 107
107 -
 108
108 -
 109
109 -
 110
110 -
 111
111 -
 112
112 -
 113
113 -
 114
114 -
 115
115 -
 116
116 -
 117
117 -
 118
118 -
 119
119 -
 120
120 -
 121
121 -
 122
122 -
 123
123 -
124
-
125
-
126
-
127
-
128
-
129
-
130
-
131
-
132
 |
 |

111
SIA Annual Report 03/04
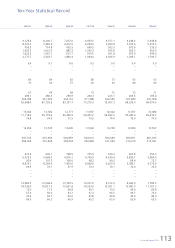
Five-Year Financial Summary of the Group
2003-04 2002-03 2001-02 2000-01 1999-00
––––––––––––––––––––––––––––––––––––––––––––––––––––––––––––––––––––––––––––––––––––––––––––––––––––––––––––––––––––––––––––––––––––––––––––––––––––––––
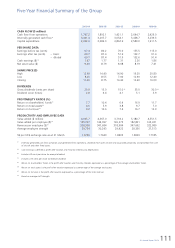
CASH FLOW ($ million)
Cash flow from operations 1,767.2 1,892.1 1,421.1 2,644.7 2,429.0
Internally generated cash flow R1 3,341.4 3,207.7 3,054.1 3,438.7 3,239.3
Capital expenditure 2,692.6 3,086.3 3,862.9 2,589.0 1,911.5
PER SHARE DATA
Earnings before tax (cents) 67.4 80.2 76.0 155.5 115.0
Earnings after tax (cents) – basic 69.7 87.4 51.9 132.7 91.4
– diluted 69.7 87.4 51.9 132.6 91.4
Cash earnings ($) R2 1.67 1.77 1.31 2.26 1.86
Net asset value ($) 9.40 8.79 8.08 8.19 7.41
SHARE PRICE ($)
High 12.90 14.40 14.90 19.20 20.80
Low 8.25 8.55 7.00 12.90 12.40
Closing 11.00 8.75 14.40 13.60 16.00
DIVIDENDS
Gross dividends (cents per share) 25.0 15.0 15.0 R3 35.0 30.0 R4
Dividend cover (times) 2.8 6.4 4.1 5.1 3.9
PROFITABILITY RATIOS (%)
Return on shareholders’ funds R5 7.7 10.4 6.4 16.9 11.7
Return on total assets R6 4.6 5.9 3.8 9.7 7.0
Return on turnover R7 9.2 10.6 7.4 16.7 12.9
PRODUCTIVITY AND EMPLOYEE DATA
Value added ($ million) 4,035.7 4,367.0 3,718.2 5,180.7 4,551.5
Value added per employee ($) R8 135,727 144,397 126,375 182,831 165,431
Revenue per employee ($) R8 328,308 347,684 318,904 347,692 322,080
Average employee strength 29,734 30,243 29,422 28,336 27,513
S$ per US$ exchange rate as at 31 March 1.6759 1.7640 1.8405 1.8029 1.7185
––––––––––––––––––––––––––––––––––––––––––––––––––––––––––––––––––––––––––––––––––––––––––––––––––––––––––––––––––––––––––––––––––––––––––––––––––––––––
R1 Internally generated cash flow comprises cash generated from operations, dividends from joint venture and associated companies, and proceeds from sale
of aircraft and other fixed assets.
R2 Cash earnings is defined as profit after taxation and minority interests plus depreciation.
R3 Includes 4.0 cents per share tax-exempt dividend.
R4 Includes 4.75 cents per share tax-exempt dividend.
R5 Return on shareholders’ funds is the profit after taxation and minority interests expressed as a percentage of the average shareholders’ funds.
R6 Return on total assets is the profit after taxation expressed as a percentage of the average total assets.
R7 Return on turnover is the profit after taxation expressed as a percentage of the total revenue.
R8 Based on average staff strength.