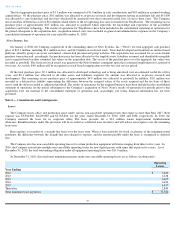
Shutterfly 2011 Annual Report Download - page 66
Download and view the complete annual report
Please find page 66 of the 2011 Shutterfly annual report below. You can navigate through the pages in the report by either clicking on the pages listed below, or by using the keyword search tool below to find specific information within the annual report.-
 1
1 -
2
-
3
-
4
-
5
-
6
-
7
-
8
-
9
-
10
-
11
-
12
-
13
-
14
-
15
-
16
-
17
-
18
-
19
-
20
-
21
-
22
-
23
-
24
-
25
-
26
-
27
-
28
-
29
-
30
-
31
-
32
-
33
-
34
-
35
-
36
-
37
-
38
-
39
-
40
-
41
-
42
-
43
-
44
-
45
-
46
-
47
-
48
-
49
-
50
-
51
-
52
-
53
-
54
-
55
-
 56
56 -
 57
57 -
 58
58 -
 59
59 -
 60
60 -
 61
61 -
 62
62 -
 63
63 -
 64
64 -
 65
65 -
 66
66 -
 67
67 -
 68
68 -
 69
69 -
 70
70 -
 71
71 -
 72
72 -
 73
73 -
 74
74 -
 75
75 -
 76
76 -
77
-
78
-
79
-
80
-
81
-
82
-
83
-
84
-
85
-
86
-
87
-
88
-
89
-
90
-
91
-
92
-
93
-
94
-
95
-
96
-
97
-
98
-
99
-
100
-
101
-
102
-
103
-
104
-
105
-
106
-
107
-
108
-
109
-
110
-
111
-
112
-
113
-
114
-
115
-
116
-
117
-
118
-
119
-
120
-
121
-
122
-
123
 |
 |

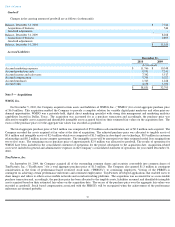
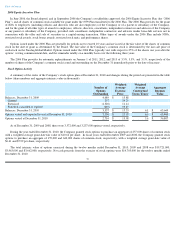
Valuation of Stock Options
The Company estimated the fair value of each option award on the date of grant using the Black-Scholes option-
pricing model and the
assumptions noted in the following table. Expected volatility is based on the historical and implied volatility of a peer group of publicly traded
entities. The expected term of options gave consideration to historical exercises, post vest cancellations and the options contractual term. The
risk-
free rate for the expected term of the option is based on the U.S. Treasury Constant Maturity at the time of grant. The assumptions used to
value options granted during the twelve months ended December 31, 2010, 2009, and 2008, were as follows:
Employee stock-
based compensation expense recognized during the years ended December 31, 2010 and 2009 was calculated based on
awards ultimately expected to vest and has been reduced for estimated forfeitures. Forfeitures are estimated at the time of grant and revised, if
necessary, in subsequent periods if actual forfeitures differ from those estimates.
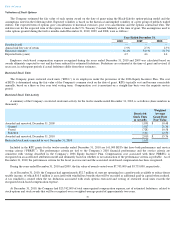
Restricted Stock Units
The Company grants restricted stock units (“RSUs”)
to its employees under the provisions of the 2006 Equity Incentive Plan. The cost
of RSUs is determined using the fair value of the Company's common stock on the date of grant. RSUs typically vest and become exercisable
annually, based on a three or four year total vesting term. Compensation cost is amortized on a straight-
line basis over the requisite service
period.
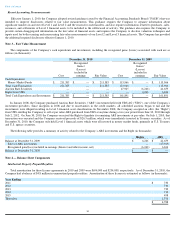
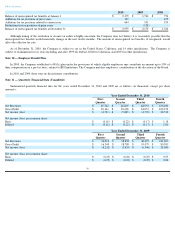
Restricted Stock Unit Activity
A summary of the Company’
s restricted stock unit activity for the twelve months ended December 31, 2010, is as follows (share numbers in
thousands):
Included in the RSU grants for the twelve months ended December 31, 2010 are 161,000 RSUs that have both performance and service
vesting criteria (“PBRSU”). The performance criteria are tied to the Company’
s 2010 financial performance and the service criteria are
consistent with vesting described in the Company’
s 2006 Equity Incentive Plan. Compensation cost associated with these PBRSUs is
recognized on an accelerated attribution model and ultimately based on whether or not satisfaction of the performance criteria is probable. As of
December 31, 2010, the performance criteria for the fiscal year was met and the associated stock-based compensation has been recognized.
During the years ended December 31, 2010 and 2009, the fair value of awards vested were $7,703,000 and $5,733,000, respectively.
As of December 31, 2010, the Company had approximately $32.7 million of state net operating loss carryforwards available to reduce future
taxable income, of which $10.3 million is associated with windfall tax benefits that will be recorded as additional paid-
in capital when realized.
A tax windfall is created when the tax deduction associated with stock options exercised and vesting of restricted stock units exceeds the
recognized stock-based compensation expense.
At December 31, 2010, the Company had $23,742,000 of total unrecognized compensation expense, net of estimated forfeitures, related to
stock options and stock awards that will be recognized over a weighted-average period of approximately two years.
Table of Contents
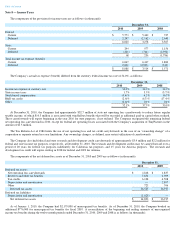
Year Ended December 31,
2010
2009
2008
Dividend yield
—
—
—
Annual risk free rate of return
1.9
%
2.3
%
2.5
%
Expected volatility
51.1
%
54.1
%
51.7
%
Expected term (years)
4.5
4.6
4.4
Restricted
Stock Units
& Awards
Weighted
Average
Grant Date
Fair Value
Awarded and unvested, December 31, 2009
1,891
$
10.48
Granted
1,017
21.36
Vested
(728)
10.58
Forfeited
(161)
12.50
Awarded and unvested, December 31, 2010
2,019
$
15.76
Restricted stock units expected to vest, December 31, 2010
1,619
56