Shutterfly 2011 Annual Report Download - page 40
Download and view the complete annual report
Please find page 40 of the 2011 Shutterfly annual report below. You can navigate through the pages in the report by either clicking on the pages listed below, or by using the keyword search tool below to find specific information within the annual report.-
 1
1 -
2
-
3
-
4
-
5
-
6
-
7
-
8
-
9
-
10
-
11
-
12
-
13
-
14
-
15
-
16
-
17
-
18
-
19
-
20
-
21
-
22
-
23
-
24
-
25
-
26
-
27
-
28
-
29
-
 30
30 -
 31
31 -
 32
32 -
 33
33 -
 34
34 -
 35
35 -
 36
36 -
 37
37 -
 38
38 -
 39
39 -
 40
40 -
 41
41 -
 42
42 -
 43
43 -
 44
44 -
 45
45 -
 46
46 -
 47
47 -
 48
48 -
 49
49 -
 50
50 -
51
-
52
-
53
-
54
-
55
-
56
-
57
-
58
-
59
-
60
-
61
-
62
-
63
-
64
-
65
-
66
-
67
-
68
-
69
-
70
-
71
-
72
-
73
-
74
-
75
-
76
-
77
-
78
-
79
-
80
-
81
-
82
-
83
-
84
-
85
-
86
-
87
-
88
-
89
-
90
-
91
-
92
-
93
-
94
-
95
-
96
-
97
-
98
-
99
-
100
-
101
-
102
-
103
-
104
-
105
-
106
-
107
-
108
-
109
-
110
-
111
-
112
-
113
-
114
-
115
-
116
-
117
-
118
-
119
-
120
-
121
-
122
-
123
 |
 |

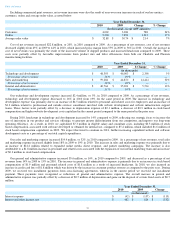
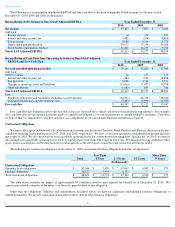
The provision for income taxes was $3.5 million for 2009, compared to a provision of $1.6 million for 2008. Our effective tax rate was 38%
in 2009, up from 30% in 2008. This increase in our effective tax rate is primarily the result of lower research and development tax credits
recorded in 2009, as compared to 2008.
As of December 31, 2009, we had approximately $32.7 million of state net operating loss carryforwards to reduce future regular taxable
income. These carryforwards will expire beginning in 2014 through 2016, if not utilized.
We recognized the remaining federal net operating loss
carryforward in 2009, except for federal net operating losses associated with our acquisition of TinyPictures in the amount of $1.7 million.
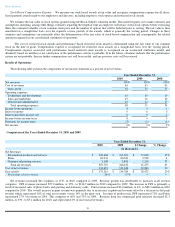
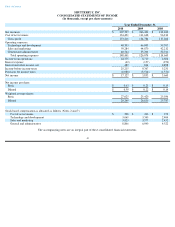
Net income increased by $2.2 million, or 60%, from 2008 to 2009. As a percentage of net revenue, net income was 3% of net revenue for
2009 compared to 2% for 2008.
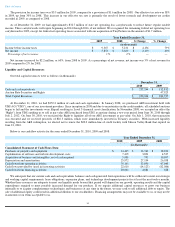
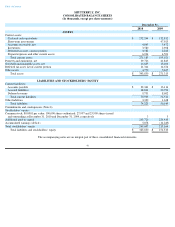
Liquidity and Capital Resources
Our total capital resources were as follows (in thousands):
At December 31, 2010, we had $252.2 million of cash and cash equivalents. In January 2008, we purchased ARS investment held with
UBS AG ("UBS"), one of our investment providers. Since inception in 2008 and due to uncertainties in the credit markets, all scheduled auctions
began to fail and the investments were illiquid resulting in Level 3 financial asset classification. In November 2008, we accepted an offer (the
“Right”) from UBS entitling us to sell at par value ARS purchased from UBS at anytime during a two-
year period from June 30, 2010 through
July 2, 2012. On June 30, 2010, we exercised the Right to liquidate all of our ARS investments at par value. On July 1, 2010, that transaction
was executed and we received proceeds of $26.3 million, which were immediately invested in Treasury securities. With increased liquidity
resulting from the ARS redemption, we elected not to renew the $20.0 million line of credit facility with Silicon Valley Bank that expired on
June 23, 2010.
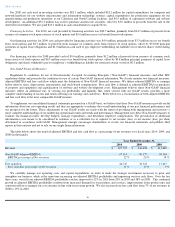
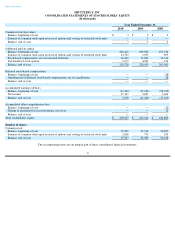
Below is our cash flow activity for the years ended December 31, 2010, 2009 and 2008:
We anticipate that our current cash and cash equivalents balances and cash generated from operations will be sufficient to meet our strategic
and working capital requirements, lease obligations, expansion plans, and technology development projects for at least the next twelve months.
Whether these resources are adequate to meet our liquidity needs beyond that period will depend on our growth, operating results and the capital
expenditures required to meet possible increased demand for our products. If we require additional capital resources to grow our business
internally or to acquire complementary technologies and businesses at any time in the future, we may seek to sell additional debt or equity. The
sale of additional equity could result in additional dilution to our stockholders. Financing arrangements may not be available to us, or may not be
in amounts or on terms acceptable to us.
Table of Contents
Year Ended December 31,
2009
2008
$ Change
% Change
(in thousands)
Income before income taxes
$
9,367
$
5,231
$
4,136
79
%
Net income
$
5,853
$
3,660
$
2,193
60
%
Percentage of net revenues
3
%
2
%
—
—
December 31,
2010
2009
Cash and cash equivalents
$
252,244
$
132,812
Auction Rate Securities and Rights
-
47,925
Total Capital Resources
$
252,244
$
180,737
Year Ended December 31,
2010
2009
2008
(in thousands)
Consolidated Statement of Cash Flows Data:
Purchases of property and equipment
$
14,405
$
13,762
$
18,220
Capitalization of software and website development costs
7,405
3,891
4,527
Acquisition of business and intangibles, net of cash acquired
5,981
795
10,097
Depreciation and amortization
25,972
27,194
26,038
Cash flows from operating activities
76,161
53,890
47,040
Cash flows provided by (used in) investing activities
22,610
(14,123
)
(82,086
)
Cash flows from financing activities
20,661
4,881
628
34