Shutterfly 2011 Annual Report Download - page 36
Download and view the complete annual report
Please find page 36 of the 2011 Shutterfly annual report below. You can navigate through the pages in the report by either clicking on the pages listed below, or by using the keyword search tool below to find specific information within the annual report.-
 1
1 -
2
-
3
-
4
-
5
-
6
-
7
-
8
-
9
-
10
-
11
-
12
-
13
-
14
-
15
-
16
-
17
-
18
-
19
-
20
-
21
-
22
-
23
-
24
-
25
-
 26
26 -
 27
27 -
 28
28 -
 29
29 -
 30
30 -
 31
31 -
 32
32 -
 33
33 -
 34
34 -
 35
35 -
 36
36 -
 37
37 -
 38
38 -
 39
39 -
 40
40 -
 41
41 -
 42
42 -
 43
43 -
 44
44 -
 45
45 -
 46
46 -
47
-
48
-
49
-
50
-
51
-
52
-
53
-
54
-
55
-
56
-
57
-
58
-
59
-
60
-
61
-
62
-
63
-
64
-
65
-
66
-
67
-
68
-
69
-
70
-
71
-
72
-
73
-
74
-
75
-
76
-
77
-
78
-
79
-
80
-
81
-
82
-
83
-
84
-
85
-
86
-
87
-
88
-
89
-
90
-
91
-
92
-
93
-
94
-
95
-
96
-
97
-
98
-
99
-
100
-
101
-
102
-
103
-
104
-
105
-
106
-
107
-
108
-
109
-
110
-
111
-
112
-
113
-
114
-
115
-
116
-
117
-
118
-
119
-
120
-
121
-
122
-
123
 |
 |

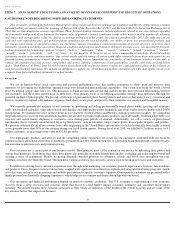
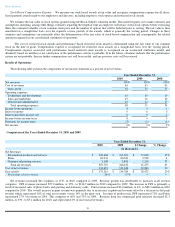
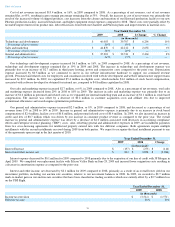
Excluding commercial print revenues, net revenue increases were also the result of year-over-year increases in each of our key metrics:
customers, orders and average order value, as noted below:
Cost of net revenues increased $22.8 million, or 20%, in 2010 compared to 2009. As a percentage of net revenues, cost of net revenues
decreased slightly from 45% in 2009 to 44% in 2010, which increased gross margin from 55% in 2009 to 56% in 2010. Overall, the increase in
cost of net revenues was primarily the result of the increased volume of shipped products and increased headcount compared to 2009. These
costs were partially offset by favorable improvements from product mix and labor efficiencies from both our Charlotte and Phoenix
manufacturing facilities.
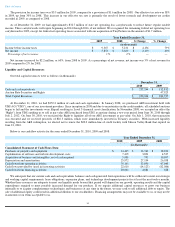
Our technology and development expense increased $2.4 million, or 5%, in 2010 compared to 2009. As a percentage of net revenues,
technology and development expense decreased to 16% in 2010 from 19% for the same period in 2009. The increase in technology and
development expense was primarily due to an increase of $4.5 million related to personnel and related costs for employees and an increase of
$3.3 million related to professional and outside services consultants involved with website development and website infrastructure support
teams. These factors were partially offset by a decrease in depreciation expense of $2.1 million, a decrease of $0.3 million in stock-
based
compensation and higher website development costs capitalized in the current period compared to the same period in the prior year.
During 2010, headcount in technology and development increased by 14% compared to 2009, reflecting our strategic focus to increase the
rate of innovation in our product and services offerings, to generate greater differentiation from our competitors, and improve our long-
term
operating efficiency. As a result, in 2010, we capitalized $7.3 million in eligible salary and consultant costs, including $0.3 million of stock
based compensation, associated with software developed or obtained for internal use, compared to $5.4 million, which included $1.6 million of
stock based compensation capitalized, in 2009. We expect this trend to continue in 2011, further increasing capitalized website and software
development costs as a percentage of our total capital expenditures.
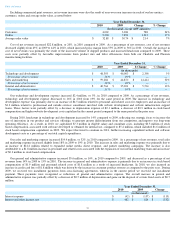
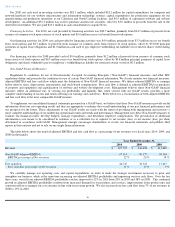
Our sales and marketing expense increased $14.4 million, or 32%, in 2010 compared to 2009. As a percentage of net revenues, total sales
and marketing expense increased slightly from 18% in 2009 to 19% in 2010. The increase in sales and marketing expense was primarily due to
an increase of $12.2 million related to expanded online media, direct response, and partner marketing campaigns. The increase is also
attributable to a $1.8 million increase in personnel and related costs associated with the expansion of our internal marketing team and an increase
of $0.3 million in stock based compensation.
Our general and administrative expense increased $5.6 million, or 16%, in 2010 compared to 2009, and decreased as a percentage of net
revenues from 14% in 2009 to 13% in 2010. The increase in general and administrative expense is primarily due to an increase in stock based
compensation of $1.9 million and personnel related costs of $1.8 million as a result of increased headcount. In 2010, we also incurred an
increase in credit card fees of $1.8 million which was driven by the increase in consumer product revenue as compared to the prior year. During
2009, we received two installment payments from cross-
licensing agreements, whereas in the current period we received one installment
payment. These payments were recognized as reductions of general and administrative expense. The overall increase in general and
administrative expense was partially offset by a decrease of $0.5 million of depreciation and gains on the disposal of certain fixed assets of $0.7
million.
Table of Contents
Year Ended December 31,
2010
2009
Change
% Change
(In thousands, except AOV amounts)
Customers
4,069
3,281
788
24
%
Orders
9,204
7,891
1,313
17
%
Average order value
$
32.88
$
30.74
$
2.14
7
%
Year Ended December 31,
2010
2009
$ Change
%
Change
(in thousands)
Technology and development
$
48,393
$
46,003
$
2,390
5
%
Percentage of net revenues
16
%
19
%
—
—
Sales and marketing
$
59,284
$
44,870
$
14,414
32
%
Percentage of net revenues
19
%
18
%
—
—
General and administrative
$
40,764
$
35,201
$
5,563
16
%
Percentage of net revenues
13
%
14
%
—
—
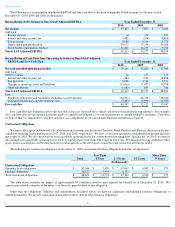
Year Ended December 31,
2010
2009
Change
(in thousands)
Interest expense
$
(42
)
$
(157
)
$
(115
)
Interest and other income, net
$
482
$
814
$
(332
)
31