Shutterfly 2011 Annual Report Download - page 37
Download and view the complete annual report
Please find page 37 of the 2011 Shutterfly annual report below. You can navigate through the pages in the report by either clicking on the pages listed below, or by using the keyword search tool below to find specific information within the annual report.-
 1
1 -
2
-
3
-
4
-
5
-
6
-
7
-
8
-
9
-
10
-
11
-
12
-
13
-
14
-
15
-
16
-
17
-
18
-
19
-
20
-
21
-
22
-
23
-
24
-
25
-
26
-
 27
27 -
 28
28 -
 29
29 -
 30
30 -
 31
31 -
 32
32 -
 33
33 -
 34
34 -
 35
35 -
 36
36 -
 37
37 -
 38
38 -
 39
39 -
 40
40 -
 41
41 -
 42
42 -
 43
43 -
 44
44 -
 45
45 -
 46
46 -
 47
47 -
48
-
49
-
50
-
51
-
52
-
53
-
54
-
55
-
56
-
57
-
58
-
59
-
60
-
61
-
62
-
63
-
64
-
65
-
66
-
67
-
68
-
69
-
70
-
71
-
72
-
73
-
74
-
75
-
76
-
77
-
78
-
79
-
80
-
81
-
82
-
83
-
84
-
85
-
86
-
87
-
88
-
89
-
90
-
91
-
92
-
93
-
94
-
95
-
96
-
97
-
98
-
99
-
100
-
101
-
102
-
103
-
104
-
105
-
106
-
107
-
108
-
109
-
110
-
111
-
112
-
113
-
114
-
115
-
116
-
117
-
118
-
119
-
120
-
121
-
122
-
123
 |
 |

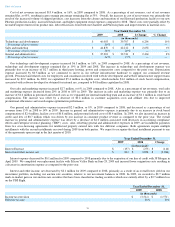
Interest expense decreased by $0.1 million or 73% for 2010 compared to 2009 primarily due to the expiration of our $20.0 million line of
credit facility with Silicon Valley Bank on June 23, 2010, which was not renewed.
Interest and other income, net decreased by $0.3 million for 2010 compared to 2009. The decrease was primarily due to the liquidation of
our ARS investments on July 1, 2010, which yielded higher returns and were subsequently invested in Treasury securities, which yielded lower
returns.
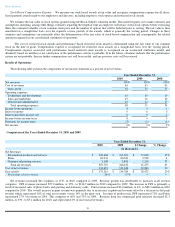
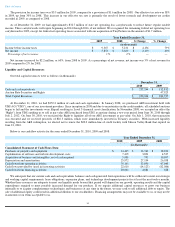
The provision for income taxes was $8.1 million for 2010, compared to a provision of $3.5 million for 2009. Our effective tax rate was 32%
in 2010, down from 38% in 2009. This decrease in our effective tax rate is primarily the result of disqualifying dispositions of incentive stock
option awards.
At December 31, 2010, we had approximately $32.7 million of state net operating loss carryforwards to reduce future regular taxable
income, of which $10.3 million is associated with windfall tax benefits that will be recorded as additional paid-
in capital when realized. These
carryforwards will expire beginning in 2016, if not utilized. We recognized the remaining federal net operating loss carryforward in 2010,
except for federal net operating losses associated with our acquisition of TinyPictures in the amount of $1.5 million.
Net income increased by $11.3 million, or 193%, from 2009 to 2010. As a percentage of net revenue, net income was 6% of net revenue for
2010 compared to 3% for 2009.
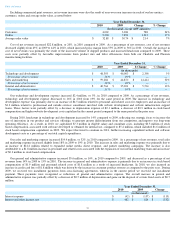
Comparison of the Years Ended December 31, 2009 and 2008
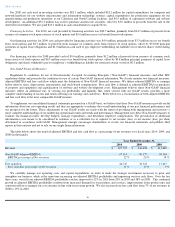
Net revenues increased $33.0 million, or 15%, in 2009 compared to 2008. Revenue growth was primarily attributable to an increase in
personalized products and services revenues and revenue from our commercial print initiative, offset by a decrease in print revenue. PPS
revenues increased $32.1 million, or 25%, to $161.7 million in 2009 compared to 2008. The increase in PPS is primarily a result of increased
sales of photo books, stationery cards and calendars. Print revenue decreased $2.7 million, or 3%, to $80.9 million in 2009 compared to
2008. 4x6 print revenue represented 14% of total net revenues versus 19% in the prior year. The decrease in overall print revenue was primarily
due to a lower average sales price for 4x6 prints which is a result of our price change in September 2008, offset partially by continued stable
growth in unit volumes. In terms of product mix, PPS represented 66% and Prints represented 33% of revenue in 2009. This compares to 61%
and 39% in 2008. Revenue from our commercial print initiative totaled $3.8 million for 2009, and represented 1% of our total net revenues.
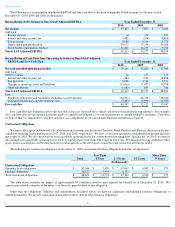
Excluding commercial print revenues, net revenue increases were also the result of year-over-
year increases in each of our key metrics:
customers, orders and average order value, as noted below:
Table of Contents
Year Ended December 31,
2010
2009
(in thousands)
Income tax provision
$
(8,088
)
$
(3,514
)
Effective tax rate
32
%
38
%
Year Ended December 31,
2010
2009
$ Change
% Change
(in thousands)
Income before income taxes
$
25,215
$
9,367
$
15,848
169
%
Net income
$
17,127
$
5,853
$
11,274
193
%
Percentage of net revenues
6
%
3
%
—
—
Year Ended December 31,
2009
2008
$ Change
% Change
(in thousands)
Net revenues
Personalized products and services
$
161,650
$
129,523
$
32,127
25
%
Prints
80,941
83,609
(2,668
)
(3
)
Commercial printing services
3,841
348
3,493
1004
Total net revenues
246,432
213,480
32,952
15
Cost of net revenues
111,648
96,214
15,434
16
Gross profit
$
134,784
$
117,266
$
17,518
15
%
Percentage of net revenues
55
%
55
%
—
—
Year Ended December 31,
2009
2008
Change
% Change
(in thousands, except AOV amounts)
Customers
3,281
2,789
493
18
%
Orders
7,891
7,569
322
4
%
Average order value
$
30.74
$
28.16
$
2.58
9
%