Shutterfly 2011 Annual Report Download - page 31
Download and view the complete annual report
Please find page 31 of the 2011 Shutterfly annual report below. You can navigate through the pages in the report by either clicking on the pages listed below, or by using the keyword search tool below to find specific information within the annual report.-
 1
1 -
2
-
3
-
4
-
5
-
6
-
7
-
8
-
9
-
10
-
11
-
12
-
13
-
14
-
15
-
16
-
17
-
18
-
19
-
20
-
 21
21 -
 22
22 -
 23
23 -
 24
24 -
 25
25 -
 26
26 -
 27
27 -
 28
28 -
 29
29 -
 30
30 -
 31
31 -
 32
32 -
 33
33 -
 34
34 -
 35
35 -
 36
36 -
 37
37 -
 38
38 -
 39
39 -
 40
40 -
 41
41 -
42
-
43
-
44
-
45
-
46
-
47
-
48
-
49
-
50
-
51
-
52
-
53
-
54
-
55
-
56
-
57
-
58
-
59
-
60
-
61
-
62
-
63
-
64
-
65
-
66
-
67
-
68
-
69
-
70
-
71
-
72
-
73
-
74
-
75
-
76
-
77
-
78
-
79
-
80
-
81
-
82
-
83
-
84
-
85
-
86
-
87
-
88
-
89
-
90
-
91
-
92
-
93
-
94
-
95
-
96
-
97
-
98
-
99
-
100
-
101
-
102
-
103
-
104
-
105
-
106
-
107
-
108
-
109
-
110
-
111
-
112
-
113
-
114
-
115
-
116
-
117
-
118
-
119
-
120
-
121
-
122
-
123
 |
 |

Basis of Presentation
Net Revenues. Our net revenues are comprised of sales generated from personalized products and services (“PPS”),
prints and commercial
printing services.
Personalized products and services
Our personalized products and services revenues are derived from the sale of photo-
based products, such as photo books, greeting
and stationery cards, calendars and other photo-
based merchandise and ancillary products and services, and the related shipping
revenues. Revenue from advertising displayed on our website and referral fees are also included in PPS revenue. Our referral fees were
approximately 0.7%, 2.5% and 3.1% of our net annual revenues for 2010, 2009 and 2008. Our referral fee program was discontinued
effective March 31, 2010, and no referral fee revenue has been recorded subsequent to that date.
Prints
We also generate revenue from photo prints and the associated shipping revenue. Photo prints consist of wallet, 2x6, 4x6, 5x7,
8x10, and large format sizes. Also included in print revenues are photocards, which are personalized silver halide photo prints with
designed content, used for greeting card occasions ranging from holidays to birthday cards and thank you notes.
Commercial print services
In order to use available print capacity during low volume periods and to leverage our large installed base of existing digital
presses, we began providing commercial printing services in 2008 to the direct marketing industry. We continue to focus our efforts in
expanding our presence in this market. For example, in November 2010, we acquired WMSG, Inc. enabling us to provide a complete
solution for variable digital print marketers and other print-on-demand opportunities.
All of our consumer revenue is recorded net of estimated returns, promotions redeemed by customers and other discounts. Customers place
orders through our website and pay primarily using credit cards. Advertising and commercial print customers are invoiced upon fulfillment.
Our business is subject to seasonal fluctuations. In particular, we generate a substantial portion of our revenues during the holiday season in
the calendar fourth quarter. We also typically experience increases in net revenues during other shopping-
related seasonal events, such as Easter,
Mother’s Day, Father’
s Day, and Halloween. We generally experience lower net revenues during the first, second and third calendar quarters
and have incurred and may continue to incur losses in these quarters. Due to the relatively short lead time required to fulfill product orders,
usually one to three business days, order backlog is not material to our business.
To further understand net revenue trends, we monitor several key metrics including:
Total Customers.
We closely monitor total customers as a key indicator of demand. Total customers include the number of
transacting customers in a given period. We seek to expand our customer base by empowering our existing customers with sharing and
collaboration services (such as Shutterfly Gallery and Shutterfly Share Sites), and by conducting integrated marketing and advertising
programs. Total customers have increased on an annual basis for each year since inception and while we expect this trend to continue,
the number of customers is dependent on whether we are successful in executing our strategy in addition to the conditions of the overall
economic environment.
Total Number of Orders.
We closely monitor the total number of orders as a leading indicator of net revenue trends. We
recognize the net revenues associated with an order when the products have been shipped and all other revenue recognition criteria have
been met. Orders are typically processed and shipped within two business days after a customer places an order. Total number of
orders has increased on an annual basis for each year since 2000, and while we anticipate this trend to continue in the future, the number
of orders is dependent on whether we are successful in executing our strategy in addition to the conditions of the overall economic
environment.
Average Order Value.
Average order value is net revenues, excluding revenues from our commercial print initiative, for a given
period divided by the total number of customer orders recorded during that same period. We seek to increase average order value as a
means of increasing net revenues. Average order value has increased on an annual basis for each year since 2000, and we anticipate that
this trend will continue in the future as consumers shift from prints into personalized products and services.
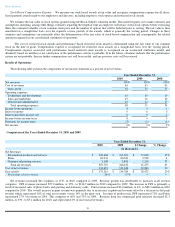
Personalized Products and Services Revenues as Percentage of Net Revenues.
We continue to innovate and improve our
personalized products and services and expect the net revenues from these products and services to increase as a percentage of total net
revenues as we continue to diversify our product offerings. Personalized products and services as a percentage of total net revenue was
71% in 2010, 66% in 2009 and 61% in 2008. We believe that this trend results, in part, from the shift of consumer spending from
offline to online outlets, as well as the increasing adoption of personalized, designed content.
We believe the analysis of these metrics and others provides us with important information on our overall net revenue trends and operating
results. Fluctuations in these metrics are not unusual and no single factor is determinative of our net revenues and operating results.
Table of Contents
27