Shutterfly 2011 Annual Report Download - page 29
Download and view the complete annual report
Please find page 29 of the 2011 Shutterfly annual report below. You can navigate through the pages in the report by either clicking on the pages listed below, or by using the keyword search tool below to find specific information within the annual report.-
 1
1 -
2
-
3
-
4
-
5
-
6
-
7
-
8
-
9
-
10
-
11
-
12
-
13
-
14
-
15
-
16
-
17
-
18
-
 19
19 -
 20
20 -
 21
21 -
 22
22 -
 23
23 -
 24
24 -
 25
25 -
 26
26 -
 27
27 -
 28
28 -
 29
29 -
 30
30 -
 31
31 -
 32
32 -
 33
33 -
 34
34 -
 35
35 -
 36
36 -
 37
37 -
 38
38 -
 39
39 -
40
-
41
-
42
-
43
-
44
-
45
-
46
-
47
-
48
-
49
-
50
-
51
-
52
-
53
-
54
-
55
-
56
-
57
-
58
-
59
-
60
-
61
-
62
-
63
-
64
-
65
-
66
-
67
-
68
-
69
-
70
-
71
-
72
-
73
-
74
-
75
-
76
-
77
-
78
-
79
-
80
-
81
-
82
-
83
-
84
-
85
-
86
-
87
-
88
-
89
-
90
-
91
-
92
-
93
-
94
-
95
-
96
-
97
-
98
-
99
-
100
-
101
-
102
-
103
-
104
-
105
-
106
-
107
-
108
-
109
-
110
-
111
-
112
-
113
-
114
-
115
-
116
-
117
-
118
-
119
-
120
-
121
-
122
-
123
 |
 |

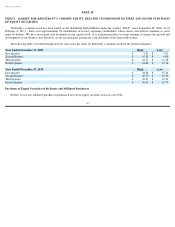
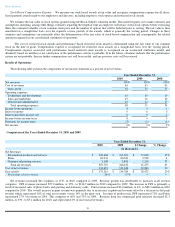
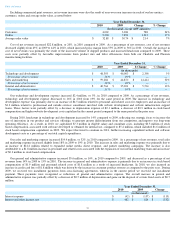
ITEM 6. SELECTED FINANCIAL DATA.
The consolidated statements of income data for the years ended December 31, 2010, 2009 and 2008 and the consolidated balance sheet
data as of December 31, 2010 and 2009 have been derived from our audited consolidated financial statements included elsewhere in this annual
report. The consolidated statements of income data for the years ended December 31, 2007 and 2006 and the consolidated balance sheet data as
of December 31, 2008, 2007 and 2006 have been derived from our audited consolidated financial statements not included in this annual report.
The following selected consolidated financial data should be read in conjunction with our “Management’
s Discussion and Analysis of Financial
Condition and Results of Operations”
and consolidated financial statements and related notes to those statements included elsewhere in this
annual report.
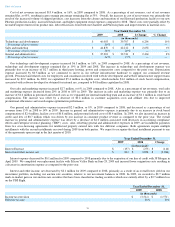
The chart above includes the following stock-based compensation amounts:
The chart below includes selected data from our balance sheet:
Table of Contents
Year Ended December 31,
2010
2009
2008
2007
2006
(In thousands, except per share amounts)
Consolidated Income Statement Data:
Net revenues
$
307,707
$
246,432
$
213,480
$
186,727
$
123,353
Cost of net revenues
134,491
111,648
96,214
84,111
55,491
Gross profit
173,216
134,784
117,266
102,616
67,862
Operating expenses:
Technology and development
48,393
46,003
39,707
28,822
19,087
Sales and marketing
59,284
44,870
42,212
33,530
21,940
General and administrative
40,764
35,201
32,741
29,888
19,216
Total operating expenses
148,441
126,074
114,660
92,240
60,243
Income from operations
24,775
8,710
2,606
10,376
7,619
Interest expense
(42
)
(157
)
(273
)
(179
)
(266
)
Interest and other income, net
482
814
2,898
5,515
2,387
Income before income taxes
25,215
9,367
5,231
15,712
9,740
Provision for income taxes
(8,088
)
(3,514
)
(1,571
)
(6,134
)
(3,942
)
Net income
$
17,127
$
5,853
$
3,660
$
9,578
$
5,798
Net income per share:
Basic
$
0.63
$
0.23
$
0.15
$
0.39
$
0.67
Diluted
$
0.59
$
0.22
$
0.14
$
0.36
$
0.56
Weighted average shares
Basic
27,025
25,420
25,036
24,295
8,622
Diluted
29,249
26,810
25,787
26,273
10,331
Year Ended December 31,
2010
2009
2008
2007
2006
(In thousands)
Cost of net revenues
$
508
$
416
$
372
$
189
$
96
Technology and development
3,069
3,340
2,404
1,067
736
Sales and marketing
3,923
3,577
2,452
1,044
521
General and administration
8,866
6,940
4,522
2,386
947
$
16,366
$
14,273
$
9,750
$
4,686
$
2,300
December 31,
2010
2009
2008
2007
2006
(In thousands)
Consolidated Balance Sheet Data:
Cash, cash equivalents, and short term investments
$
252,244
$
180,737
$
88,164
$
125,584
$
119,051
Property and equipment, net
39,726
41,845
48,108
48,416
30,919
Working capital
200,282
141,410
58,232
104,025
102,165
Total assets
343,830
271,313
233,297
208,938
180,160
Capital lease obligations, less current portion
6
10
17
107
1,742
Total stockholders
’
equity
269,607
215,164
186,802
170,734
151,326
25