Sharp 2011 Annual Report Download - page 65
Download and view the complete annual report
Please find page 65 of the 2011 Sharp annual report below. You can navigate through the pages in the report by either clicking on the pages listed below, or by using the keyword search tool below to find specific information within the annual report.-
 1
1 -
2
-
3
-
4
-
5
-
6
-
7
-
8
-
9
-
10
-
11
-
12
-
13
-
14
-
15
-
16
-
17
-
18
-
19
-
20
-
21
-
22
-
23
-
24
-
25
-
26
-
27
-
28
-
29
-
30
-
31
-
32
-
33
-
34
-
35
-
36
-
37
-
38
-
39
-
40
-
41
-
42
-
43
-
44
-
45
-
46
-
47
-
48
-
49
-
50
-
51
-
52
-
53
-
54
-
 55
55 -
 56
56 -
 57
57 -
 58
58 -
 59
59 -
 60
60 -
 61
61 -
 62
62 -
 63
63 -
 64
64 -
 65
65 -
 66
66 -
 67
67 -
 68
68 -
 69
69 -
 70
70
 |
 |

63
Annual Report 2011
Financial Section
Additional information
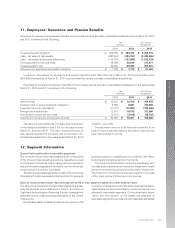
Effective for the year ended March 31, 2011, the Company
has applied the “Accounting Standard for Disclosures about
Segments of an Enterprise and Related Information”
(Accounting Standards Board of Japan (ASBJ) Statement No.
17, issued by the ASBJ on March 27, 2009) and the Guidance
on Accounting Standard for Disclosures about Segments of
an Enterprise and Related Information” (ASBJ Guidance No.
20, issued by the ASBJ on March 21, 2008).
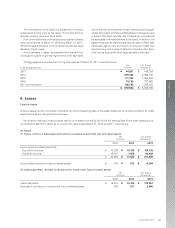
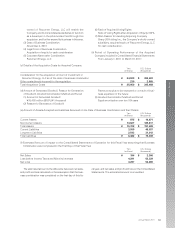
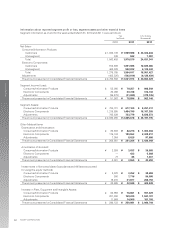
Sales to outside customers:
LCD Color TVs
LCDs
Mobile Phones
Others
Total
2011
Yen
(millions)
2011
¥ 803,592
614,373
413,277
1,190,731
¥ 3,021,973
$ 9,799,902
7,492,354
5,039,963
14,521,110
$ 36,853,329
U.S. Dollars
(thousands)
Related information
Sales by product/service for the year ended March 31, 2011 were as follows:
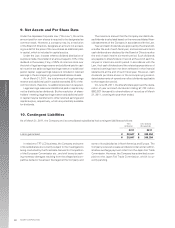
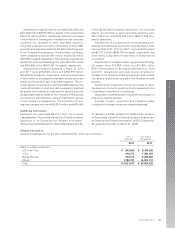
Adjustments of segment income were ¥(36,278) million and
¥(31,089) million ($(379,135) thousand) for the years ended
March 31, 2010 and 2011, respectively, and were comprised
of elimination of intersegment transactions and corporate
expenses not allocated to each reportable segment.
Corporate expenses are mainly attributable to basic R&D
expenses and expenses related to the administrative groups
of the Company’s headquarters. The elimination of interseg-
ment transactions were ¥(1,967) million and ¥3,083 million
($37,598 thousand), respectively. The corporate expenses not
allocated to each reportable segment were ¥(37,237) million
and ¥(35,880) million ($(437,561) thousand), respectively.
Adjustments of segment assets as of March 31, 2010
and 2011 were ¥782,839 million and ¥723,779 million
($8,826,573 thousand), respectively, and were comprised
of elimination of intersegment transactions and corporate
assets not allocated to each reportable segment. The cor-
porate assets not allocated to each reportable segment are
mainly attributable to cash and cash equivalents, deferred
tax assets, the Company’s investments in securities, as well
as depreciable assets related to: the Company’s R&D groups
as well as the administrative, sales and distribution groups
of the Company’s headquarters. The elimination of inter-
segment transactions were ¥(38,357) million and ¥(36,464)
million ($(444,683) thousand), respectively. The corporate
assets not allocated to each reportable segment were
¥821,196 million and ¥760,243 million ($9,271,256 thou-
sand), respectively.
Adjustments of investments in nonconsolidated sub-
sidiaries and affiliates accounted for using the equity meth-
ods as of March 31, 2010 and 2011 were ¥19,215 million
and ¥21,877 million ($266,792 thousand), respectively, and
were mainly comprised of investments in Sharp Finance
Corporation.
Adjustments of increase in plant, equipment and intangi-
ble assets were ¥11,864 million and ¥14,900 million
($181,708 thousand) for the years ended March 31, 2010
and 2011, respectively, and were mainly comprised of
increase in the Company’s R&D groups and the administra-
tive, sales and distribution groups of the Company’s head-
quarters.
Adjustments of segment income were made to recon-
cile segment income to operating income presented in the
Consolidated Statements of Operations.
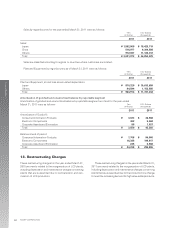
Depreciation and amortization includes the amortization of
long-term prepaid expenses.
Increase in plant, equipment and intangible assets
includes the increase in long-term prepaid expenses.