Sharp 2011 Annual Report Download - page 64
Download and view the complete annual report
Please find page 64 of the 2011 Sharp annual report below. You can navigate through the pages in the report by either clicking on the pages listed below, or by using the keyword search tool below to find specific information within the annual report.-
 1
1 -
2
-
3
-
4
-
5
-
6
-
7
-
8
-
9
-
10
-
11
-
12
-
13
-
14
-
15
-
16
-
17
-
18
-
19
-
20
-
21
-
22
-
23
-
24
-
25
-
26
-
27
-
28
-
29
-
30
-
31
-
32
-
33
-
34
-
35
-
36
-
37
-
38
-
39
-
40
-
41
-
42
-
43
-
44
-
45
-
46
-
47
-
48
-
49
-
50
-
51
-
52
-
53
-
 54
54 -
 55
55 -
 56
56 -
 57
57 -
 58
58 -
 59
59 -
 60
60 -
 61
61 -
 62
62 -
 63
63 -
 64
64 -
 65
65 -
 66
66 -
 67
67 -
 68
68 -
 69
69 -
 70
70
 |
 |

62 SHARP CORPORATION
Financial Section
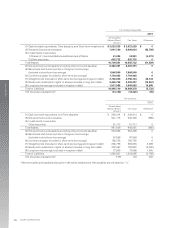
Net Sales:
Consumer/Information Products:
Customers
Intersegment
Total
Electronic Components:
Customers
Intersegment
Total
Adjustments
The amount presented in Consolidated Financial Statements
Segment Income (Loss):
Consumer/Information Products
Electronic Components
Adjustments
The amount presented in Consolidated Financial Statements
Segment Assets:
Consumer/Information Products
Electronic Components
Adjustments
The amount presented in Consolidated Financial Statements
Other Material Items
Depreciation and Amortization:
Consumer/Information Products
Electronic Components
Adjustments
The amount presented in Consolidated Financial Statements
Amortization of Goodwill:
Consumer/Information Products
Electronic Components
Adjustments
The amount presented in Consolidated Financial Statements
Investments in Nonconsolidated Subsidiaries and Affiliates accounted
for using the equity methods:
Consumer/Information Products
Electronic Components
Adjustments
The amount presented in Consolidated Financial Statements
Increase in Plant, Equipment and Intangible Assets:
Consumer/Information Products
Electronic Components
Adjustments
The amount presented in Consolidated Financial Statements
2011
Yen
(millions)
2010
¥ 1,843,139
349
1,843,488
912,809
462,976
1,375,785
(463,325)
¥ 2,755,948
¥ 53,095
35,086
(36,278)
¥ 51,903
¥ 734,721
1,318,695
782,839
¥ 2,836,255
¥ 85,803
176,124
7,054
¥ 268,981
¥ 2,924
—
77
¥ 3,001
¥ 2,970
500
19,215
¥ 22,685
¥ 66,959
207,300
11,864
¥ 286,123
2011
¥ 1,969,988
582
1,970,570
1,051,985
502,032
1,554,017
(502,614)
¥ 3,021,973
¥ 79,257
30,728
(31,089)
¥ 78,896
¥ 677,100
1,484,799
723,779
¥ 2,885,678
¥ 82,276
190,963
8,025
¥ 281,264
¥ 3,033
432
85
¥ 3,550
¥ 3,252
7,716
21,877
¥ 32,845
¥ 76,861
159,220
14,900
¥ 250,981
$ 24,024,244
7,097
24,031,341
12,829,085
6,122,342
18,951,427
(6,129,439)
$ 36,853,329
$ 966,549
374,732
(379,135)
$ 962,146
$ 8,257,317
18,107,305
8,826,573
$ 35,191,195
$ 1,003,366
2,328,817
97,866
$ 3,430,049
$ 36,988
5,268
1,037
$ 43,293
$ 39,659
94,098
266,792
$ 400,549
$ 937,329
1,941,707
181,708
$ 3,060,744
U.S. Dollars
(thousands)
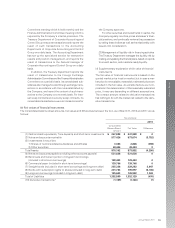
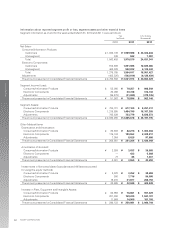
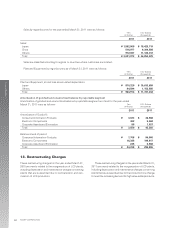
Information about reported segment profit or loss, segment assets and other material items
Segment information as of and for the years ended March 31, 2010 and 2011 were as follows: