Sharp 2011 Annual Report Download - page 5
Download and view the complete annual report
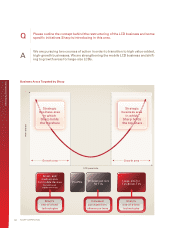
Please find page 5 of the 2011 Sharp annual report below. You can navigate through the pages in the report by either clicking on the pages listed below, or by using the keyword search tool below to find specific information within the annual report.-
 1
1 -
 2
2 -
 3
3 -
 4
4 -
 5
5 -
 6
6 -
 7
7 -
 8
8 -
 9
9 -
 10
10 -
 11
11 -
 12
12 -
 13
13 -
 14
14 -
 15
15 -
 16
16 -
17
-
18
-
19
-
20
-
21
-
22
-
23
-
24
-
25
-
26
-
27
-
28
-
29
-
30
-
31
-
32
-
33
-
34
-
35
-
36
-
37
-
38
-
39
-
40
-
41
-
42
-
43
-
44
-
45
-
46
-
47
-
48
-
49
-
50
-
51
-
52
-
53
-
54
-
55
-
56
-
57
-
58
-
59
-
60
-
61
-
62
-
63
-
64
-
65
-
66
-
67
-
68
-
69
-
70
 |
 |

3
Annual Report 2011
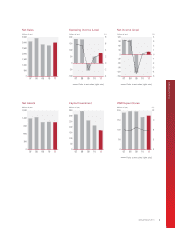
Financial Highlights
(billions of yen)
07 08 09 10 11
0
500
1,000
1,500
2,000
2,500
3,000
3,500
Net Sales
(billions of yen) (%)
07 08 09 10 11
-100
-50
0
50
100
150
200
Operating Income (Loss)
-4
-2
0
2
4
6
8
Ratio to net sales [right axis]
(%)(billions of yen)
07 08 09 10 11
-150
-120
-90
-60
-30
0
30
60
90
120
Net Income (Loss)
-5
-4
-3
-2
-1
0
1
2
3
4
Ratio to net sales [right axis]
(billions of yen)
07 08 09 10 11
0
300
600
900
1,200
1,500
Net Assets
(billions of yen)
07 08 09 10 11
0
50
100
150
200
250
300
350
Capital Investment
(%)(billions of yen)
07 08 09 10 11
0
50
100
150
200
R&D Expenditures
0
3
6
9
12
Ratio to net sales [right axis]