Sharp 2011 Annual Report Download - page 49
Download and view the complete annual report
Please find page 49 of the 2011 Sharp annual report below. You can navigate through the pages in the report by either clicking on the pages listed below, or by using the keyword search tool below to find specific information within the annual report.-
 1
1 -
2
-
3
-
4
-
5
-
6
-
7
-
8
-
9
-
10
-
11
-
12
-
13
-
14
-
15
-
16
-
17
-
18
-
19
-
20
-
21
-
22
-
23
-
24
-
25
-
26
-
27
-
28
-
29
-
30
-
31
-
32
-
33
-
34
-
35
-
36
-
37
-
38
-
 39
39 -
 40
40 -
 41
41 -
 42
42 -
 43
43 -
 44
44 -
 45
45 -
 46
46 -
 47
47 -
 48
48 -
 49
49 -
 50
50 -
 51
51 -
 52
52 -
 53
53 -
 54
54 -
 55
55 -
 56
56 -
 57
57 -
 58
58 -
 59
59 -
60
-
61
-
62
-
63
-
64
-
65
-
66
-
67
-
68
-
69
-
70
 |
 |

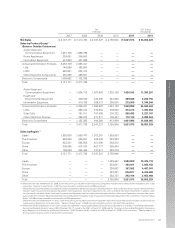
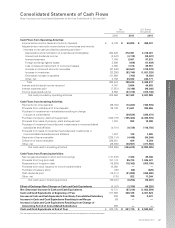
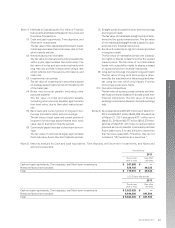
Consolidated Statements of Cash Flows
Sharp Corporation and Consolidated Subsidiaries for the Years Ended March 31, 2010 and 2011
47
Annual Report 2011
Financial Section
Cash Flows from Operating Activities:
Income before income taxes and minority interests
Adjustments to reconcile income before income taxes and minority
interests to net cash provided by operating activities—
Depreciation and amortization of properties and intangibles
Interest and dividends income
Interest expenses
Foreign exchange (gains) losses
Loss on sales and retirement of noncurrent assets
Increase in notes and accounts receivable
Increase in inventories
(Decrease) increase in payables
Other, net
Total
Interest and dividends income received
Interest expenses paid
Income taxes (paid) refund
Net cash provided by operating activities
Cash Flows from Investing Activities:
Payments into time deposits
Proceeds from withdrawal of time deposits
Purchase of investments in subsidiaries resulting in change
in scope of consolidation
Purchase of property, plant and equipment
Proceeds from sales of property, plant and equipment
Purchase of investment securities and investments in nonconsolidated
subsidiaries and affiliates
Proceeds from sales of investment securities and investments in
nonconsolidated subsidiaries and affiliates
Payments of loans receivable
Collection of loans receivable
Other, net
Net cash used in investing activities
Cash Flows from Financing Activities:
Net increase (decrease) in short-term borrowings
Proceeds from long-term debt
Repayments of long-term debt
Proceeds from stock issuance to minority shareholders
Purchase of treasury stock
Cash dividends paid
Other, net
Net cash used in financing activities
Effect of Exchange Rate Change on Cash and Cash Equivalents
Net (Decrease) Increase in Cash and Cash Equivalents
Cash and Cash Equivalents at Beginning of Year
Increase in Cash and Cash Equivalents from Newly Consolidated Subsidiary
Increase in Cash and Cash Equivalents Resulting from Merger
Increase in Cash and Cash Equivalents Resulting from Change of
Accounting Period of Consolidated Subsidiaries
Cash and Cash Equivalents at End of Year
2011
Yen
(millions)
2010
¥ 6,139
264,429
(3,547)
7,794
3,609
4,930
(97,440)
(22,250)
131,698
3,156
298,518
4,041
(7,551)
8,556
303,564
(39,764)
39,138
—
(222,772)
1,910
(4,101)
1,207
(226,114)
226,281
(29,590)
(253,805)
(171,315)
157,174
(15,634)
10,000
(80)
(15,411)
(175)
(35,441)
(4,187)
10,131
317,358
228
69
339
¥ 328,125
2011
¥ 40,880
272,081
(3,119)
8,001
(938)
7,376
(60,547)
(83,749)
(762)
20,022
199,245
3,664
(8,148)
(27,318)
167,443
(13,200)
31,641
(24,524)
(195,404)
992
(9,738)
130
(4,448)
439
(30,501)
(244,613)
7,328
85,725
(78,162)
—
(68)
(21,999)
922
(6,254)
(3,790)
(87,214)
328,125
199
—
—
¥ 241,110
$ 498,537
3,318,061
(38,037)
97,573
(11,439)
89,951
(738,378)
(1,021,329)
(9,293)
244,171
2,429,817
44,683
(99,366)
(333,146)
2,041,988
(160,976)
385,866
(299,073)
(2,382,976)
12,098
(118,756)
1,585
(54,244)
5,354
(371,963)
(2,983,085)
89,366
1,045,427
(953,195)
—
(829)
(268,280)
11,244
(76,267)
(46,220)
(1,063,584)
4,001,524
2,427
—
—
$ 2,940,367
U.S. Dollars
(thousands)
The accompanying notes to the consolidated financial statements are an integral part of these statements.