Sharp 2011 Annual Report Download - page 43
Download and view the complete annual report
Please find page 43 of the 2011 Sharp annual report below. You can navigate through the pages in the report by either clicking on the pages listed below, or by using the keyword search tool below to find specific information within the annual report.-
 1
1 -
2
-
3
-
4
-
5
-
6
-
7
-
8
-
9
-
10
-
11
-
12
-
13
-
14
-
15
-
16
-
17
-
18
-
19
-
20
-
21
-
22
-
23
-
24
-
25
-
26
-
27
-
28
-
29
-
30
-
31
-
32
-
 33
33 -
 34
34 -
 35
35 -
 36
36 -
 37
37 -
 38
38 -
 39
39 -
 40
40 -
 41
41 -
 42
42 -
 43
43 -
 44
44 -
 45
45 -
 46
46 -
 47
47 -
 48
48 -
 49
49 -
 50
50 -
 51
51 -
 52
52 -
 53
53 -
54
-
55
-
56
-
57
-
58
-
59
-
60
-
61
-
62
-
63
-
64
-
65
-
66
-
67
-
68
-
69
-
70
 |
 |
41
Annual Report 2011
Financial Section
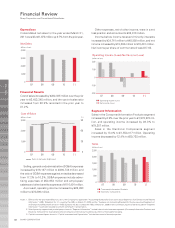
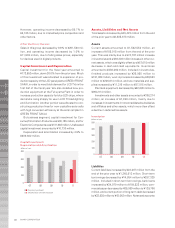
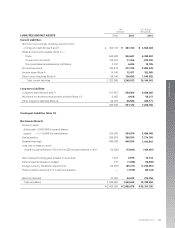
payable amounted to ¥602,081 million, a decrease of
¥51,072 million. Other current liabilities increased by
¥70,546 million to ¥126,692 million.
Long-term liabilities increased by ¥44,631 million to
¥591,120 million. This was mainly due to a ¥41,969 mil-
lion increase in long-term debt.
Interest-bearing debt was ¥847,250 million, an
increase of ¥27,115 million.
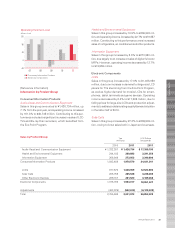
Net Assets
Net assets amounted to ¥1,048,645 million, a decrease
of ¥17,215 million. Foreign currency translation adjust-
ments decreased by ¥13,034 million from the end of the
prior year, due to foreign exchange fluctuations. The equi-
ty ratio was 35.6%.
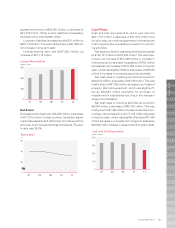
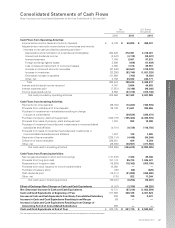
Cash Flows
Cash and cash equivalents at end of year stood at
¥241,110 million, a decrease of ¥87,015 million over
the prior year, as combined payments in investing and
financing activities exceeded proceeds from operat-
ing activities.
Net cash provided by operating activities decreased
by ¥136,121 million to ¥167,443 million. This was main-
ly due to an increase of ¥61,499 million in increase in
inventories and a decrease in payables of ¥762 million
(compared to an increase of ¥131,698 million in the prior
year), which was slightly offset by a decrease of ¥36,893
million in increase in notes and accounts receivable.
Net cash used in investing activities amounted to
¥244,613 million, a decrease of ¥9,192 million. This was
mainly due to a ¥27,368 million decrease in purchase of
property, plant and equipment, which was slightly off-
set by ¥24,524 million payments for purchase of
investments in subsidiaries resulting in the change in
scope of consolidation.
Net cash used in financing activities amounted to
¥6,254 million, a decrease of ¥29,187 million. This was
mainly due to a ¥7,328 million increase in short-term bor-
rowings, net (compared to a ¥171,315 million decrease
in the prior year), which was slightly offset by a ¥71,449
million decrease in proceeds from long-term debt and a
¥62,528 million increase in repayments of long-term debt.
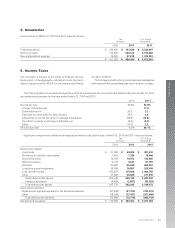
0
300
600
900
07 08 09 10 11
Interest-Bearing Debt
(billions of yen)
0
30
40
50
07 08 09 10 11
Equity Ratio
(%)
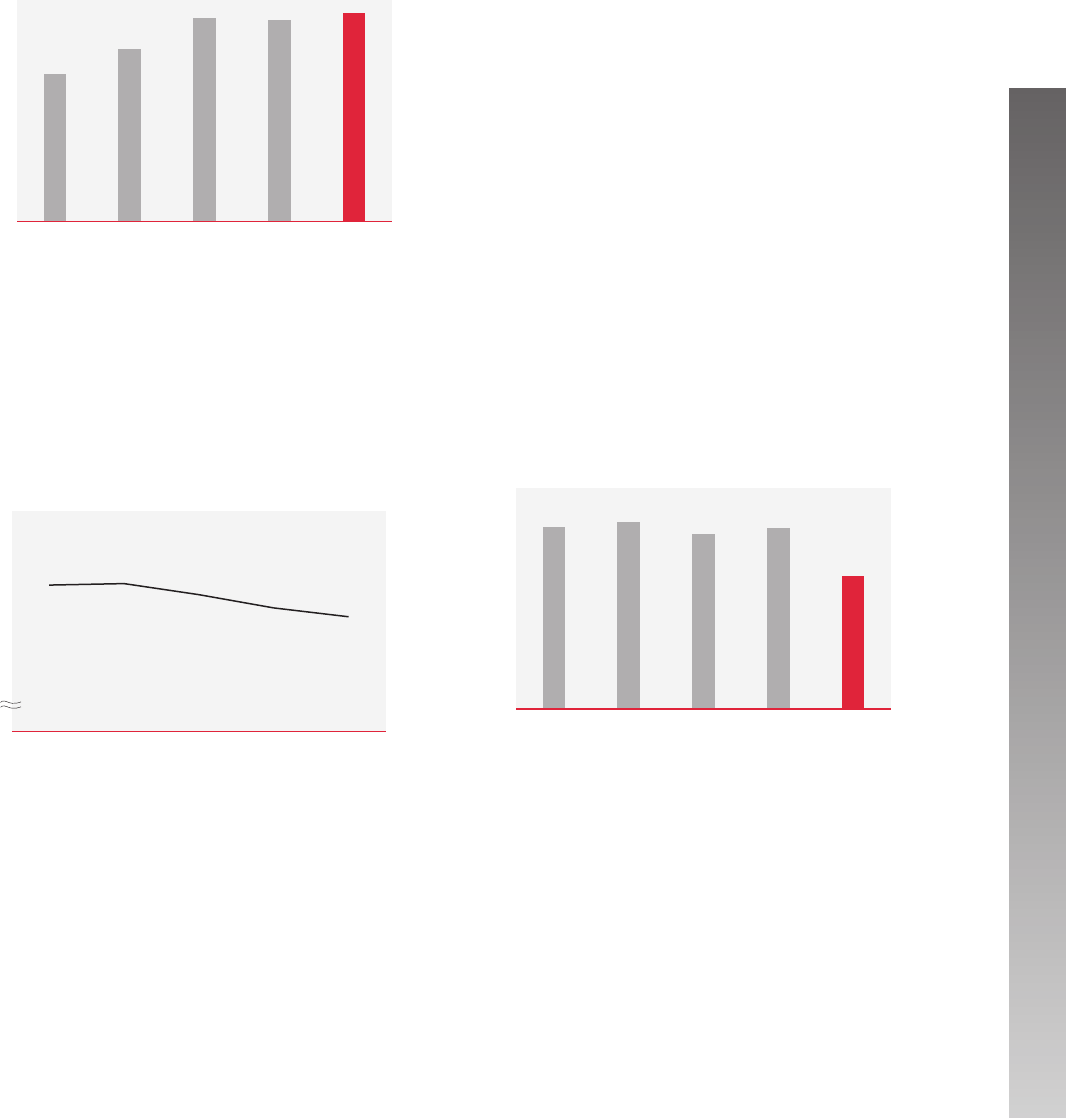
0
100
200
300
400
07 08 09 10 11
Cash and Cash Equivalents
(billions of yen)