Sharp 2004 Annual Report Download - page 48
Download and view the complete annual report
Please find page 48 of the 2004 Sharp annual report below. You can navigate through the pages in the report by either clicking on the pages listed below, or by using the keyword search tool below to find specific information within the annual report.-
 1
1 -
2
-
3
-
4
-
5
-
6
-
7
-
8
-
9
-
10
-
11
-
12
-
13
-
14
-
15
-
16
-
17
-
18
-
19
-
20
-
21
-
22
-
23
-
24
-
25
-
26
-
27
-
28
-
29
-
30
-
31
-
32
-
33
-
34
-
35
-
36
-
37
-
 38
38 -
 39
39 -
 40
40 -
 41
41 -
 42
42 -
 43
43 -
 44
44 -
 45
45 -
 46
46 -
 47
47 -
 48
48 -
 49
49 -
 50
50 -
 51
51 -
 52
52
 |
 |

46 Sharp Annual Report 2004
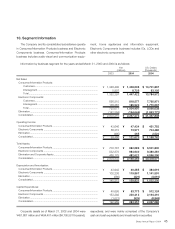
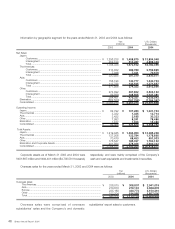
Information by geographic segment for the years ended March 31, 2003 and 2004 is as follows:
Net Sales:
Japan:
Customers..............................................................................................
Intersegment ..........................................................................................
Total.......................................................................................................
The Americas:
Customers..............................................................................................
Intersegment ..........................................................................................
Total ......................................................................................................
Asia:
Customers .............................................................................................
Intersegment ..........................................................................................
Total ......................................................................................................
Other:
Customers..............................................................................................
Intersegment ..........................................................................................
Total.......................................................................................................
Elimination.......................................................................................................
Consolidated ...................................................................................................
Operating Income:
Japan ..............................................................................................................
The Americas ..................................................................................................
Asia .................................................................................................................
Other...............................................................................................................
Elimination.......................................................................................................
Consolidated ...................................................................................................
Total Assets:
Japan ..............................................................................................................
The Americas ..................................................................................................
Asia .................................................................................................................
Other...............................................................................................................
Elimination and Corporate Assets ....................................................................
Consolidated ...................................................................................................
$ 13,894,048
4,888,448
18,782,496
2,759,895
70,676
2,830,571
1,340,733
1,271,857
2,612,590
3,503,162
1,033,381
4,536,543
(7,264,362)
$ 21,497,838
$ 1,021,743
12,714
30,333
78,486
15,486
$ 1,158,762
$ 13,285,238
1,178,895
651,933
1,762,162
3,600,343
$ 20,478,571
¥ 1,458,875
513,287
1,972,162
289,789
7,421
297,210
140,777
133,545
274,322
367,832
108,505
476,337
(762,758)
¥ 2,257,273
¥ 107,283
1,335
3,185
8,241
1,626
¥ 121,670
¥ 1,394,950
123,784
68,453
185,027
378,036
¥ 2,150,250
¥ 1,256,238
452,100
1,708,338
313,882
7,046
320,928
158,198
113,788
271,986
274,892
89,569
364,461
(662,503)
¥ 2,003,210
¥ 82,792
3,382
3,422
7,993
1,877
¥ 99,466
¥ 1,219,045
137,206
70,470
176,547
401,564
¥ 2,004,832
200420042003
Yen
(millions) U.S. Dollars
(thousands)
200420042003
Yen
(millions) U.S. Dollars
(thousands)
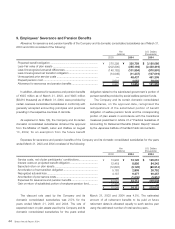
Corporate assets as of March 31 2003 and 2004 were
¥481,667 million and ¥494,401 million ($4,708,581 thousand),
respectively, and were mainly comprised of the Company’s
cash and cash equivalents and investments in securities.
Overseas sales were comprised of overseas
subsidiaries’ sales and the Company’s and domestic
subsidiaries’ export sales to customers.
Overseas sales:
The Americas...............................................................................................
Asia .............................................................................................................
Europe.........................................................................................................
Other ...........................................................................................................
Total ............................................................................................................
$ 2,941,019
2,658,676
3,150,210
1,857,000
$ 10,606,905
¥ 308,807
279,161
330,772
194,985
¥ 1,113,725
¥ 336,815
270,618
235,168
103,204
¥ 945,805
Overseas sales for the years ended March 31, 2003 and 2004 were as follows: