Sharp 2004 Annual Report Download - page 47
Download and view the complete annual report
Please find page 47 of the 2004 Sharp annual report below. You can navigate through the pages in the report by either clicking on the pages listed below, or by using the keyword search tool below to find specific information within the annual report.-
 1
1 -
2
-
3
-
4
-
5
-
6
-
7
-
8
-
9
-
10
-
11
-
12
-
13
-
14
-
15
-
16
-
17
-
18
-
19
-
20
-
21
-
22
-
23
-
24
-
25
-
26
-
27
-
28
-
29
-
30
-
31
-
32
-
33
-
34
-
35
-
36
-
 37
37 -
 38
38 -
 39
39 -
 40
40 -
 41
41 -
 42
42 -
 43
43 -
 44
44 -
 45
45 -
 46
46 -
 47
47 -
 48
48 -
 49
49 -
 50
50 -
 51
51 -
 52
52
 |
 |

Sharp Annual Report 2004 45
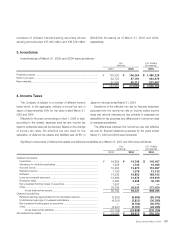
Net Sales:
Consumer/Information Products:
Customers.............................................................................................
Intersegment .........................................................................................
Total......................................................................................................
Electronic Components:
Customers.............................................................................................
Intersegment .........................................................................................
Total......................................................................................................
Elimination....................................................................................................
Consolidated ................................................................................................
Operating Income:
Consumer/Information Products...................................................................
Electronic Components ................................................................................
Elimination....................................................................................................
Consolidated ................................................................................................
Total Assets:
Consumer/Information Products...................................................................
Electronic Components ................................................................................
Elimination and Corporate Assets .................................................................
Consolidated ................................................................................................
Depreciation and Amortization:
Consumer/Information Products...................................................................
Electronic Components ................................................................................
Elimination....................................................................................................
Consolidated ................................................................................................
Capital Expenditures:
Consumer/Information Products...................................................................
Electronic Components ................................................................................
Elimination....................................................................................................
Consolidated ................................................................................................
$ 13,701,867
83,105
13,784,972
7,795,971
1,770,667
9,566,638
(1,853,772)
$ 21,497,838
$ 451,752
704,486
2,524
$ 1,158,762
$ 6,501,800
9,380,381
4,596,390
$ 20,478,571
$ 384,619
1,141,591
(4,010)
$ 1,522,200
$ 512,124
2,194,410
(8,848)
$ 2,697,686
¥ 1,438,696
8,726
1,447,422
818,577
185,920
1,004,497
(194,646)
¥ 2,257,273
¥ 47,434
73,971
265
¥ 121,670
¥ 682,689
984,940
482,621
¥ 2,150,250
¥ 40,385
119,867
(421)
¥ 159,831
¥ 53,773
230,413
(929)
¥ 283,257
¥ 1,346,400
5,997
1,352,397
656,810
136,867
793,677
(142,864)
¥ 2,003,210
¥ 43,646
56,315
(495)
¥ 99,466
¥ 703,787
832,870
468,175
¥ 2,004,832
¥ 43,942
102,236
(360)
¥ 145,818
¥ 40,698
153,292
(1,021)
¥ 192,969
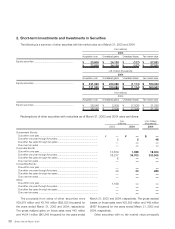
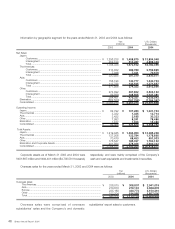
Corporate assets as of March 31, 2003 and 2004 were
¥481,667 million and ¥494,401 million ($4,708,581 thousand),
respectively, and were mainly comprised of the Company’s
cash and cash equivalents and investments in securities.
200420042003
Yen
(millions) U.S. Dollars
(thousands)
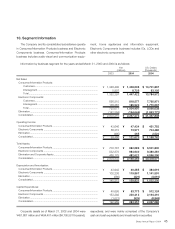
The Company and its consolidated subsidiaries operate
in Consumer/Information Products business and Electronic
Components business. Consumer/Information Products
business includes audio-visual and communication equip-
ment, home appliances and information equipment.
Electronic Components business includes ICs, LCDs and
other electronic components.
10. Segment Information
Information by business segment for the years ended March 31, 2003 and 2004 is as follows: