Sharp 2004 Annual Report Download - page 31
Download and view the complete annual report
Please find page 31 of the 2004 Sharp annual report below. You can navigate through the pages in the report by either clicking on the pages listed below, or by using the keyword search tool below to find specific information within the annual report.-
 1
1 -
2
-
3
-
4
-
5
-
6
-
7
-
8
-
9
-
10
-
11
-
12
-
13
-
14
-
15
-
16
-
17
-
18
-
19
-
20
-
 21
21 -
 22
22 -
 23
23 -
 24
24 -
 25
25 -
 26
26 -
 27
27 -
 28
28 -
 29
29 -
 30
30 -
 31
31 -
 32
32 -
 33
33 -
 34
34 -
 35
35 -
 36
36 -
 37
37 -
 38
38 -
 39
39 -
 40
40 -
 41
41 -
42
-
43
-
44
-
45
-
46
-
47
-
48
-
49
-
50
-
51
-
52
 |
 |
Sharp Annual Report 2004 29
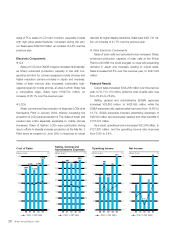
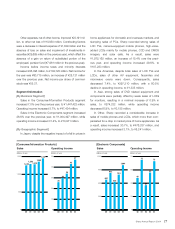
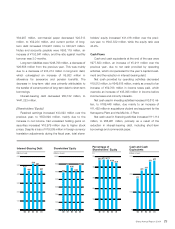
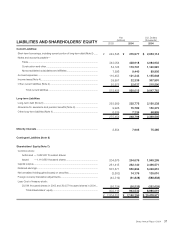
¥84,987 million, commercial paper decreased ¥22,513
million, to ¥82,234 million, and current portion of long-
term debt increased ¥19,987 million, to ¥48,227 million.
Notes and accounts payable were ¥558,119 million, an
increase of ¥153,641 million, and the ratio against monthly
turnover was 3.0 months.
Long-term liabilities were ¥248,798 million, a decrease of
¥26,656 million from the previous year. This was mainly
due to a decrease of ¥33,214 million in long-term debt,
which outweighed an increase of ¥5,863 million in
allowance for severance and pension benefits. The
decrease in long-term debt was primarily attributable to
the transfer of current portion of long-term debt to short-term
borrowings.
Interest-bearing debt decreased ¥60,182 million, to
¥441,223 million.
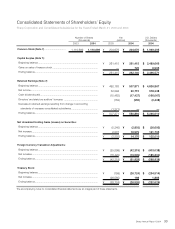
[Shareholders’ Equity]
Retained earnings increased ¥43,023 million over the
previous year, to ¥550,894 million, mainly due to the
increase in net income. Net unrealized holding gains on
securities increased ¥16,979 million due to higher stock
prices. Despite a loss of ¥19,509 million in foreign currency
translation adjustments during the fiscal year, total share-
holders’ equity increased ¥41,416 million over the previ-
ous year, to ¥943,532 million, while the equity ratio was
43.9%.
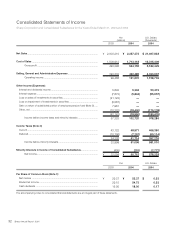
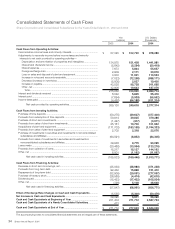
Cash Flows
Cash and cash equivalents at the end of the year were
¥277,623 million, an increase of ¥5,911 million over the
previous year, due to net cash provided by operating
activities, which compensated for the year’s capital invest-
ment and the reduction in interest-bearing debt.
Net cash provided by operating activities decreased
¥19,512 million, to ¥249,618 million, mainly as a result of an
increase of ¥59,708 million in income taxes paid, which
overrode an increase of ¥45,395 million in income before
income taxes and minority interests.
Net cash used in investing activities increased ¥3,613 mil-
lion, to ¥169,446 million, due mainly to an increase of
¥11,452 million in acquisitions of plant and equipment for the
Kameyama Plant and the Mie No. 3 Plant.
Net cash used in financing activities increased ¥11,114
million, to ¥68,961 million, primarily as a result of the
reduction in interest-bearing debt, including short-term
borrowings and commercial paper.
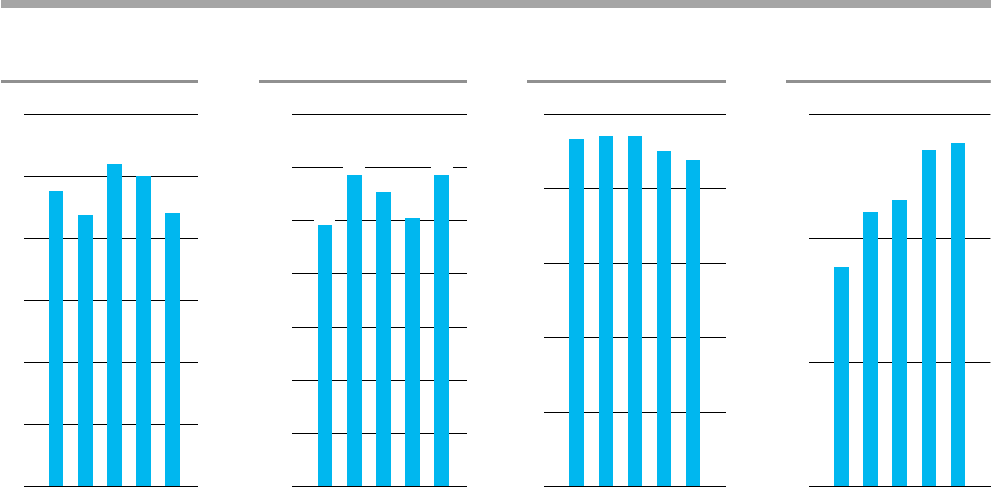
0
10
20
30
40
50
00 01 02 0403
46
.
6
43
.
9
47
.
147
.
1
45
.
0
650
700
750
800
850
900
950
1
,
000
00 01 02 0403
926
902
896
943 943
Percentage of
Shareholders’ Equity
Shareholders’ Equity
00 01 02 0403
476
441
438
519 501
0
100
200
300
400
500
600
Interest-Bearing Debt
00 01 02 0403
177
277
221 231
271
0
100
200
300
Cash and Cash
Equivalents
(billions of yen) (billions of yen) (billions of yen)(%)