Sharp 2004 Annual Report Download - page 30
Download and view the complete annual report
Please find page 30 of the 2004 Sharp annual report below. You can navigate through the pages in the report by either clicking on the pages listed below, or by using the keyword search tool below to find specific information within the annual report.-
 1
1 -
2
-
3
-
4
-
5
-
6
-
7
-
8
-
9
-
10
-
11
-
12
-
13
-
14
-
15
-
16
-
17
-
18
-
19
-
 20
20 -
 21
21 -
 22
22 -
 23
23 -
 24
24 -
 25
25 -
 26
26 -
 27
27 -
 28
28 -
 29
29 -
 30
30 -
 31
31 -
 32
32 -
 33
33 -
 34
34 -
 35
35 -
 36
36 -
 37
37 -
 38
38 -
 39
39 -
 40
40 -
41
-
42
-
43
-
44
-
45
-
46
-
47
-
48
-
49
-
50
-
51
-
52
 |
 |
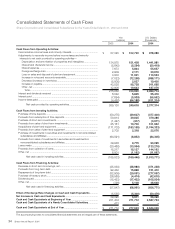
28 Sharp Annual Report 2004
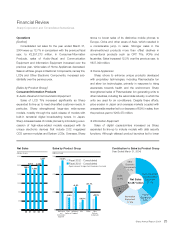
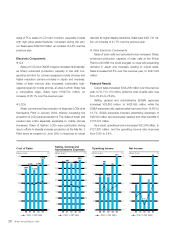
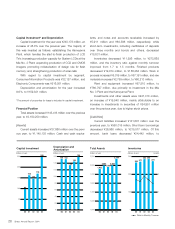
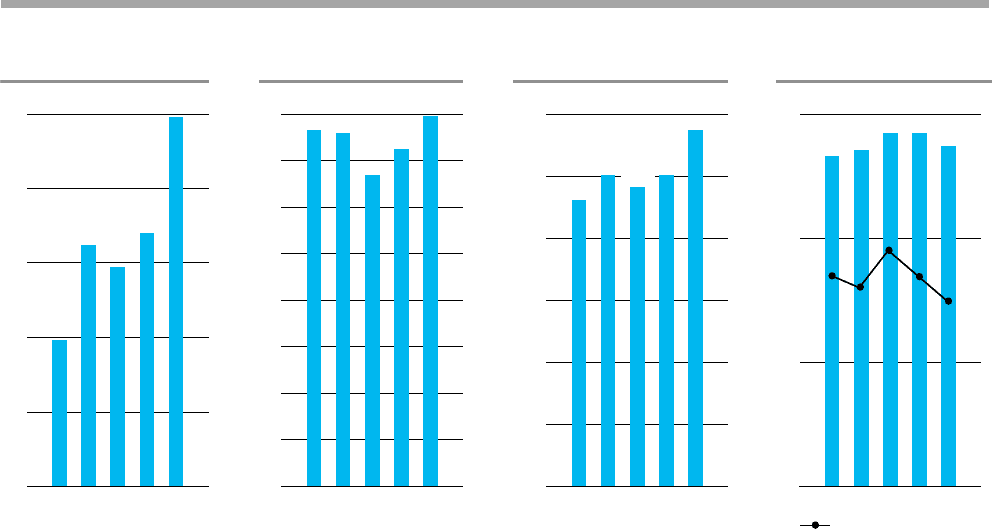
Capital Investment* and Depreciation
Capital investment for the year was ¥248,178 million, an
increase of 45.8% over the previous year. The majority of
this was invested as follows: establishing the Kameyama
Plant, which handles the start-to-finish production of LCD
TVs; increasing production capacity for System LCDs at the
Mie No. 3 Plant; expanding production of CCD and CMOS
imagers; promoting miniaturization of design rule for flash
memory; and, strengthening production of solar cells.
With regard to capital investment by segment,
Consumer/Information Products was ¥32,127 million, and
Electronic Components was ¥216,051 million.
Depreciation and amortization for the year increased
9.6%, to ¥159,831 million.
*The amount of properties for lease is included in capital investment.
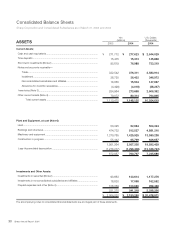
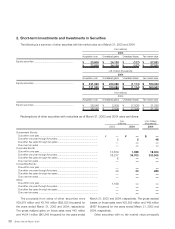
Financial Position
Total assets increased ¥145,418 million over the previous
year, to ¥2,150,250 million.
[Assets]
Current assets increased ¥37,660 million over the previ-
ous year, to ¥1,148,135 million. Cash and cash equiva-
lents, and notes and accounts receivable increased by
¥5,911 million and ¥60,596 million, respectively, while
short-term investments, including certificates of deposits
over three months and bonds and others, decreased
¥18,631 million.
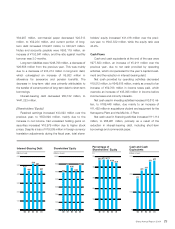
Inventories decreased ¥11,296 million, to ¥273,668
million, and the inventory ratio against monthly turnover
improved from 1.7 to 1.5 months. Finished products
decreased ¥19,074 million, to ¥156,264 million. Work in
process increased ¥5,019 million, to ¥57,191 million, and raw
materials increased ¥2,759 million, to ¥60,213 million.
Plant and equipment increased ¥87,810 million, to
¥760,797 million, due primarily to investment in the Mie
No. 3 Plant and the Kameyama Plant.
Investments and other assets were ¥241,318 million,
an increase of ¥19,948 million, mainly attributable to an
increase in investments in securities of ¥24,951 million
over the previous year, due to higher stock prices.
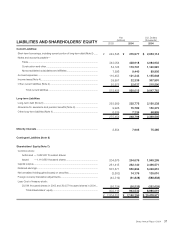
[Liabilities]
Current liabilities increased ¥131,607 million over the
previous year, to ¥950,015 million. Short-term borrowings
decreased ¥26,968 million, to ¥215,577 million. Of this
amount, bank loans decreased ¥24,442 million, to
Ratio to Monthly Turnover
0
20
40
60
80
100
120
140
160
00 01 02 0403
153
159
152
133
145
00 01 02 0403
98
248
162
147
170
0
50
100
150
200
250
Depreciation and
Amortization
Capital Investment
1
,
000
1
,
200
1
,
400
1
,
600
1
,
800
2
,
000
2
,
200
00 01 02 0403
1
,
922
2
,
150
2
,
003
1
,
966
2
,
004
Total Assets
00 01 02 0403
266 271
284 284
0
100
200
300
273
0
1
2
3
Inventories
(billions of yen) (billions of yen) (billions of yen) (billions of yen) (month)