Sharp 2004 Annual Report Download - page 42
Download and view the complete annual report
Please find page 42 of the 2004 Sharp annual report below. You can navigate through the pages in the report by either clicking on the pages listed below, or by using the keyword search tool below to find specific information within the annual report.-
 1
1 -
2
-
3
-
4
-
5
-
6
-
7
-
8
-
9
-
10
-
11
-
12
-
13
-
14
-
15
-
16
-
17
-
18
-
19
-
20
-
21
-
22
-
23
-
24
-
25
-
26
-
27
-
28
-
29
-
30
-
31
-
 32
32 -
 33
33 -
 34
34 -
 35
35 -
 36
36 -
 37
37 -
 38
38 -
 39
39 -
 40
40 -
 41
41 -
 42
42 -
 43
43 -
 44
44 -
 45
45 -
 46
46 -
 47
47 -
 48
48 -
 49
49 -
 50
50 -
 51
51 -
 52
52
 |
 |

40 Sharp Annual Report 2004
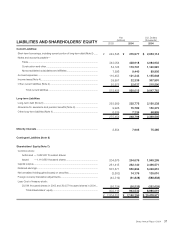
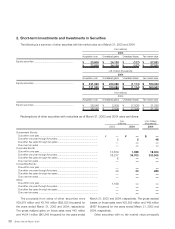
Bank loans ......................................................................................................
Banker’s acceptances payable........................................................................
Commercial paper...........................................................................................
Current portion of long-term debt ....................................................................
$ 809,400
1,228
783,181
459,305
$ 2,053,114
¥ 84,987
129
82,234
48,227
¥ 215,577
¥ 109,429
129
104,747
28,240
¥ 242,545
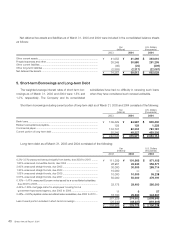
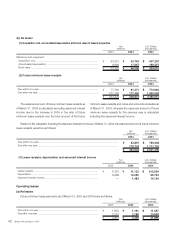
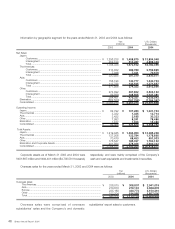
Long-term debt as of March 31, 2003 and 2004 consisted of the following:
0.3%–3.5% unsecured loans principally from banks, due 2003 to 2018 .........
1.60% unsecured convertible bonds, due 2004 ..............................................
2.00% unsecured straight bonds, due 2005....................................................
1.30% unsecured straight bonds, due 2003....................................................
1.65% unsecured straight bonds, due 2005....................................................
0.57% unsecured straight bonds, due 2007....................................................
0.10%—1.47% unsecured Euroyen notes issued by a consolidated subsidiary,
due 2003 to 2008..........................................................................................
4.45%–7.20% mortgage loans for employees’ housing from a
government-sponsored agency, due 2003 to 2009 .......................................
0.48%—0.93% payables under securitized lease receivables, due 2003 to 2010
...
Less-Current portion included in short-term borrowings ..................................
$ 971,105
256,571
285,714
—
95,238
476,191
280,000
57
244,667
2,609,543
(459,305)
$ 2,150,238
¥ 101,966
26,940
30,000
—
10,000
50,000
29,400
6
25,690
274,002
(48,227)
¥ 225,775
¥ 111,389
26,951
30,000
10,000
10,000
50,000
32,178
11
16,700
287,229
(28,240)
¥ 258,989
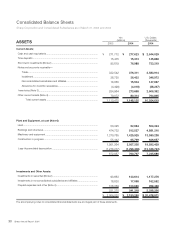
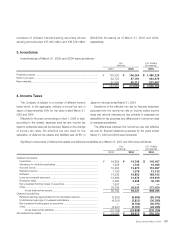
Other current assets........................................................................................
Prepaid expenses and other............................................................................
Other current liabilities .....................................................................................
Other long-term liabilities .................................................................................
Net deferred tax assets ...................................................................................
$ 393,010
291,295
(209)
(22,067)
$ 662,029
¥ 41,266
30,586
(22)
(2,317)
¥ 69,513
¥ 41,052
36,249
(46)
(2,888)
¥ 74,367
Net deferred tax assets and liabilities as of March 31, 2003 and 2004 were included in the consolidated balance sheets
as follows:
200420042003
Yen
(millions) U.S. Dollars
(thousands)
200420042003
Yen
(millions) U.S. Dollars
(thousands)
200420042003
Yen
(millions) U.S. Dollars
(thousands)
5. Short-term Borrowings and Long-term Debt
The weighted average interest rates of short-term bor-
rowings as of March 31, 2003 and 2004 were 1.5% and
1.3%, respectively. The Company and its consolidated
subsidiaries have had no difficulty in renewing such loans
when they have considered such renewal advisable.
Short-term borrowings including current portion of long-term debt as of March 31, 2003 and 2004 consisted of the following: