Seagate 2005 Annual Report Download - page 60
Download and view the complete annual report
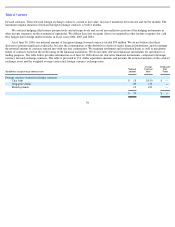
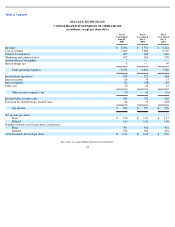
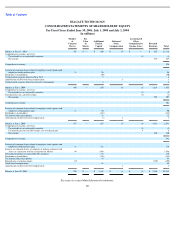
Please find page 60 of the 2005 Seagate annual report below. You can navigate through the pages in the report by either clicking on the pages listed below, or by using the keyword search tool below to find specific information within the annual report.-
 1
1 -
2
-
3
-
4
-
5
-
6
-
7
-
8
-
9
-
10
-
11
-
12
-
13
-
14
-
15
-
16
-
17
-
18
-
19
-
20
-
21
-
22
-
23
-
24
-
25
-
26
-
27
-
28
-
29
-
30
-
31
-
32
-
33
-
34
-
35
-
36
-
37
-
38
-
39
-
40
-
41
-
42
-
43
-
44
-
45
-
46
-
47
-
48
-
49
-
 50
50 -
 51
51 -
 52
52 -
 53
53 -
 54
54 -
 55
55 -
 56
56 -
 57
57 -
 58
58 -
 59
59 -
 60
60 -
 61
61 -
 62
62 -
 63
63 -
 64
64 -
 65
65 -
 66
66 -
 67
67 -
 68
68 -
 69
69 -
 70
70 -
71
-
72
-
73
-
74
-
75
-
76
-
77
-
78
-
79
-
80
-
81
-
82
-
83
-
84
-
85
-
86
-
87
-
88
-
89
-
90
-
91
-
92
-
93
-
94
-
95
-
96
-
97
-
98
-
99
-
100
-
101
-
102
-
103
-
104
-
105
-
106
-
107
-
108
-
109
-
110
-
111
-
112
-
113
-
114
-
115
-
116
-
117
-
118
-
119
-
120
-
121
-
122
-
123
-
124
-
125
-
126
-
127
-
128
-
129
-
130
-
131
-
132
-
133
-
134
-
135
-
136
-
137
-
138
-
139
-
140
-
141
-
142
-
143
-
144
-
145
-
146
-
147
-
148
-
149
-
150
-
151
-
152
-
153
-
154
-
155
-
156
 |
 |

Table of Contents
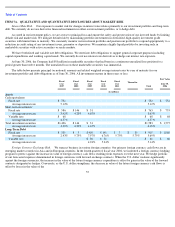
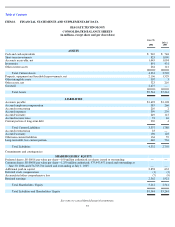
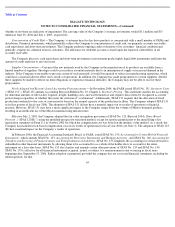
SEAGATE TECHNOLOGY
CONSOLIDATED STATEMENTS OF OPERATIONS
(in millions, except per share data)
See notes to consolidated financial statements.
58
Fiscal
Year Ended
June 30,
2006
Fiscal
Year Ended
July 1,
2005
Fiscal
Year Ended
July 2,
2004
Revenue
$
9,206
$
7,553
$
6,224
Cost of revenue
7,069
5,880
4,765
Product development
805
645
666
Marketing and administrative
447
306
290
Amortization of intangibles
7
—
—
Restructuring, net
4
—
59
Total operating expenses
8,332
6,831
5,780
Income from operations
874
722
444
Interest income
69
36
17
Interest expense
(41
)
(48
)
(45
)
Other, net
22
22
12
Other income (expense), net
50
10
(16
)
Income before income taxes
924
732
428
Provision for (benefit from) income taxes
84
25
(101
)
Net income
$
840
$
707
$
529
Net income per share:
Basic
$
1.70
$
1.51
$
1.17
Diluted
1.60
1.41
1.06
Number of shares used in per share calculations:
Basic
495
468
452
Diluted
524
502
498
Cash dividends declared per share
$
0.32
$
0.26
$
0.20