Seagate 2005 Annual Report Download - page 117
Download and view the complete annual report
Please find page 117 of the 2005 Seagate annual report below. You can navigate through the pages in the report by either clicking on the pages listed below, or by using the keyword search tool below to find specific information within the annual report.-
 1
1 -
2
-
3
-
4
-
5
-
6
-
7
-
8
-
9
-
10
-
11
-
12
-
13
-
14
-
15
-
16
-
17
-
18
-
19
-
20
-
21
-
22
-
23
-
24
-
25
-
26
-
27
-
28
-
29
-
30
-
31
-
32
-
33
-
34
-
35
-
36
-
37
-
38
-
39
-
40
-
41
-
42
-
43
-
44
-
45
-
46
-
47
-
48
-
49
-
50
-
51
-
52
-
53
-
54
-
55
-
56
-
57
-
58
-
59
-
60
-
61
-
62
-
63
-
64
-
65
-
66
-
67
-
68
-
69
-
70
-
71
-
72
-
73
-
74
-
75
-
76
-
77
-
78
-
79
-
80
-
81
-
82
-
83
-
84
-
85
-
86
-
87
-
88
-
89
-
90
-
91
-
92
-
93
-
94
-
95
-
96
-
97
-
98
-
99
-
100
-
101
-
102
-
103
-
104
-
105
-
106
-
 107
107 -
 108
108 -
 109
109 -
 110
110 -
 111
111 -
 112
112 -
 113
113 -
 114
114 -
 115
115 -
 116
116 -
 117
117 -
 118
118 -
 119
119 -
 120
120 -
 121
121 -
 122
122 -
 123
123 -
 124
124 -
 125
125 -
 126
126 -
 127
127 -
128
-
129
-
130
-
131
-
132
-
133
-
134
-
135
-
136
-
137
-
138
-
139
-
140
-
141
-
142
-
143
-
144
-
145
-
146
-
147
-
148
-
149
-
150
-
151
-
152
-
153
-
154
-
155
-
156
 |
 |

Table of Contents
SEAGATE TECHNOLOGY
NOTES TO CONSOLIDATED FINANCIAL STATEMENTS—(Continued)
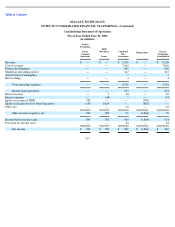
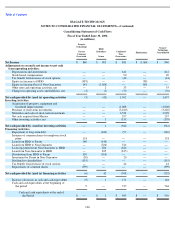
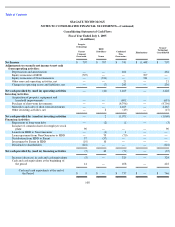
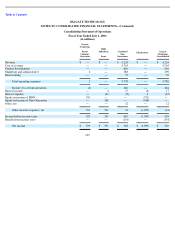
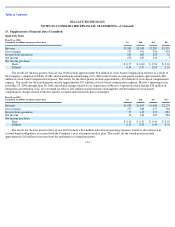
15. Supplementary Financial Data (Unaudited)
Quarterly Data
The results for the first quarter of fiscal year 2006 include approximately $16 million of stock-based compensation expense as a result of
the Company’s adoption of SFAS 123(R) and $4 million in restructuring costs. The results for the second quarter include approximately $20
million of stock-based compensation expense. The results for the third quarter include approximately $21 million of stock-based compensation
expense. The results for the fourth quarter include approximately $17 million of stock-based compensation expense, Maxtor’s operating losses
from May 19, 2006 through June 30, 2006 and related charges related to our acquisition of Maxtor Corporation which include $38 million in
integration and retention costs, net of related tax effects, $24 million in amortization of intangibles and $16 million in stock-based
compensation charges related to Maxtor options assumed and nonvested shares exchanged.
The results for the first quarter of fiscal year 2005 include a $14 million reduction in operating expenses related to the reduction in
accrued benefit obligations associated with the Company’s post-retirement medical plan. The results for the fourth quarter include
approximately $10 million in income from the settlement of a litigation matter.
114
Fiscal Year 2006
Unaudited, in millions except per share data
1st
2nd
3rd
4th
Revenue
$
2,088
$
2,300
$
2,289
$
2,529
Gross margin
535
591
556
454
Income from operations
265
284
253
72
Net income
272
287
274
7
Net income per share:
Basic
$
0.57
$
0.60
$
0.56
$
0.01
Diluted
0.54
0.57
0.53
0.01
Fiscal Year 2005
Unaudited, in millions except per share data
1st
2nd
3rd
4th
Revenue
$
1,558
$
1,847
$
1,969
$
2,179
Gross margin
275
380
477
540
Income from operations
57
147
237
281
Net income
54
144
229
280
Net income per share:
Basic
$
0.12
$
0.31
$
0.49
$
0.59
Diluted
0.11
0.29
0.45
0.55