Rite Aid 2015 Annual Report Download - page 84
Download and view the complete annual report
Please find page 84 of the 2015 Rite Aid annual report below. You can navigate through the pages in the report by either clicking on the pages listed below, or by using the keyword search tool below to find specific information within the annual report.-
 1
1 -
2
-
3
-
4
-
5
-
6
-
7
-
8
-
9
-
10
-
11
-
12
-
13
-
14
-
15
-
16
-
17
-
18
-
19
-
20
-
21
-
22
-
23
-
24
-
25
-
26
-
27
-
28
-
29
-
30
-
31
-
32
-
33
-
34
-
35
-
36
-
37
-
38
-
39
-
40
-
41
-
42
-
43
-
44
-
45
-
46
-
47
-
48
-
49
-
50
-
51
-
52
-
53
-
54
-
55
-
56
-
57
-
58
-
59
-
60
-
61
-
62
-
63
-
64
-
65
-
66
-
67
-
68
-
69
-
70
-
71
-
72
-
73
-
 74
74 -
 75
75 -
 76
76 -
 77
77 -
 78
78 -
 79
79 -
 80
80 -
 81
81 -
 82
82 -
 83
83 -
 84
84 -
 85
85 -
 86
86 -
 87
87 -
 88
88 -
 89
89 -
 90
90 -
 91
91 -
 92
92 -
 93
93 -
 94
94 -
95
-
96
-
97
-
98
-
99
-
100
-
101
-
102
-
103
-
104
-
105
-
106
-
107
-
108
-
109
-
110
-
111
-
112
-
113
-
114
-
115
-
116
-
117
-
118
-
119
-
120
-
121
-
122
-
123
-
124
-
125
-
126
-
127
-
128
-
129
-
130
-
131
 |
 |

RITE AID CORPORATION AND SUBSIDIARIES
NOTES TO CONSOLIDATED FINANCIAL STATEMENTS (Continued)
For the Years Ended February 28, 2015, March 1, 2014 and March 2, 2013
(In thousands, except per share amounts)
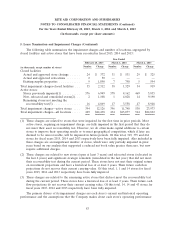
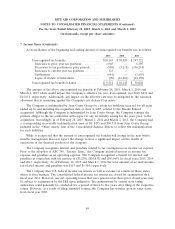
5. Lease Termination and Impairment Charges (Continued)
in future periods. Projected cash flows are updated based on the next year’s operating budget which
includes the qualitative factors noted above. The Company utilizes the three-level valuation hierarchy
for the recognition and disclosure of fair value measurements. The categorization of assets and
liabilities within this hierarchy is based upon the lowest level of input that is significant to the
measurement of fair value. The three levels of the hierarchy consist of the following:
• Level 1—Inputs to the valuation methodology are unadjusted quoted prices in active markets for
identical assets or liabilities that the Company has the ability to access at the measurement date.
• Level 2—Inputs to the valuation methodology are quoted prices for similar assets and liabilities
in active markets, quoted prices in markets that are not active or inputs that are observable for
the asset or liability, either directly or indirectly, for substantially the full term of the instrument.
• Level 3—Inputs to the valuation methodology are unobservable inputs based upon
management’s best estimate of inputs market participants could use in pricing the asset or
liability at the measurement date, including assumptions about risk.
Long-lived non-financial assets are measured at fair value on a nonrecurring basis for purposes of
calculating impairment using Level 2 and Level 3 inputs as defined in the fair value hierarchy. The fair
value of long-lived assets using Level 2 inputs is determined by evaluating the current economic conditions
in the geographic area for similar use assets. The fair value of long-lived assets using Level 3 inputs is
determined by estimating the amount and timing of net future cash flows (which are unobservable inputs)
and discounting them using a risk-adjusted rate of interest (which is Level 1). The Company estimates
future cash flows based on its experience and knowledge of the market in which the store is located.
Significant increases or decreases in actual cash flows may result in valuation changes.
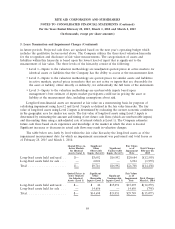
The table below sets forth by level within the fair value hierarchy the long-lived assets as of the
impairment measurement date for which an impairment assessment was performed and total losses as
of February 28, 2015 and March 1, 2014:
Quoted Prices in Significant Fair Values
Active Markets Other Significant as of Total Charges
for Identical Observable Unobservable Impairment February 28,
Assets (Level 1) Inputs (Level 2) Inputs (Level 3) Date 2015
Long-lived assets held and used . . $— $3,692 $16,992 $20,684 $(12,503)
Long-lived assets held for sale .... — 6,024 — 6,024 (1,935)
Total ...................... $— $9,716 $16,992 $26,708 $(14,438)
Quoted Prices in Significant Fair Values
Active Markets Other Significant as of
for Identical Observable Unobservable Impairment Total Charges
Assets (Level 1) Inputs (Level 2) Inputs (Level 3) Date March 1, 2014
Long-lived assets held and used . . $— $ 42 $15,051 $15,093 $(12,279)
Long-lived assets held for sale . . . — 14,656 — 14,656 (798)
Total ...................... $— $14,698 $15,051 $29,749 $(13,077)
84