Rite Aid 2015 Annual Report Download - page 33
Download and view the complete annual report
Please find page 33 of the 2015 Rite Aid annual report below. You can navigate through the pages in the report by either clicking on the pages listed below, or by using the keyword search tool below to find specific information within the annual report.-
 1
1 -
2
-
3
-
4
-
5
-
6
-
7
-
8
-
9
-
10
-
11
-
12
-
13
-
14
-
15
-
16
-
17
-
18
-
19
-
20
-
21
-
22
-
 23
23 -
 24
24 -
 25
25 -
 26
26 -
 27
27 -
 28
28 -
 29
29 -
 30
30 -
 31
31 -
 32
32 -
 33
33 -
 34
34 -
 35
35 -
 36
36 -
 37
37 -
 38
38 -
 39
39 -
 40
40 -
 41
41 -
 42
42 -
 43
43 -
44
-
45
-
46
-
47
-
48
-
49
-
50
-
51
-
52
-
53
-
54
-
55
-
56
-
57
-
58
-
59
-
60
-
61
-
62
-
63
-
64
-
65
-
66
-
67
-
68
-
69
-
70
-
71
-
72
-
73
-
74
-
75
-
76
-
77
-
78
-
79
-
80
-
81
-
82
-
83
-
84
-
85
-
86
-
87
-
88
-
89
-
90
-
91
-
92
-
93
-
94
-
95
-
96
-
97
-
98
-
99
-
100
-
101
-
102
-
103
-
104
-
105
-
106
-
107
-
108
-
109
-
110
-
111
-
112
-
113
-
114
-
115
-
116
-
117
-
118
-
119
-
120
-
121
-
122
-
123
-
124
-
125
-
126
-
127
-
128
-
129
-
130
-
131
 |
 |
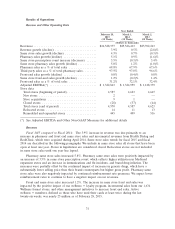
$104.1 million in fiscal 2014, and savings associated with our Purchasing and Delivery Arrangement. We
expect lower reimbursement rates to continue to have a negative impact on our gross margin.
Gross profit increased by $5.5 million in fiscal 2014 compared to fiscal 2013. Pharmacy gross profit
was higher due to the continued benefit of generic drug introductions, purchasing efficiencies on
generic drugs, favorable reimbursement rate adjustments from a decision by California to exclude
certain drugs from the retroactive MediCal reimbursement rate adjustments as well as from certain
commercial third party payors and brand drug inflation, partially offset by a decrease in same store
prescription count and continued reimbursement pressures. Front-end gross profit was slightly higher
due to higher vendor promotional funding, partially offset by lower sales and higher promotional
markdowns. Gross profit was negatively impacted by a LIFO charge in fiscal 2014 compared to a LIFO
credit in fiscal 2013. Overall gross margin was 28.7% for fiscal 2014 compared to 28.8% in fiscal 2013.
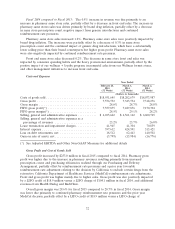
We use the last-in, first-out (LIFO) method of inventory valuation, which is determined annually
when inflation rates and inventory levels are finalized. Therefore, LIFO costs for interim period
financial statements are estimated. The LIFO credit for fiscal 2015 was $18.9 million compared to a
LIFO charge of $104.1 million in fiscal 2014 and a LIFO credit of $147.9 million in fiscal 2013. The
LIFO credit for fiscal 2015 as compared to the LIFO charge in the prior year is due primarily to higher
generic deflation and lower pharmacy inventory in our distribution centers resulting from our
Purchasing and Delivery Arrangement.
During fiscal 2014, we experienced higher inflation on brand pharmacy products than during fiscal
2013, partially offset by deflation on generic pharmacy products, which contributed to overall inflation
in fiscal 2014 and a LIFO charge of $104.1 million.
During fiscal 2013, we experienced significant price decreases on high volume generic
introductions. During the first few months after new generic drugs are introduced, supplier prices tend
to decrease as multiple suppliers enter the market place. This resulted in significant deflation on
generic pharmacy products which more than offset brand pharmacy product inflation, causing overall
deflation in fiscal 2013, and consequently, resulted in a LIFO credit of $147.9 million.
Selling, General and Administrative Expenses
SG&A as a percentage of revenue was 25.2% in fiscal 2015 compared to 25.7% in fiscal 2014. The
decrease in SG&A as a percentage of revenues for fiscal 2015 was a result of leveraging the increase in
revenues and through various cost control initiatives. The increase in SG&A on a dollar basis of
$134.5 million in fiscal 2015 compared to fiscal 2014 is due primarily to higher salary and payroll
related expenses, other store operating expenses and operating costs of Health Dialog and RediClinic.
These amounts are partially offset by the $30.5 million fiscal 2014 tax indemnification asset reversal,
which did not recur in fiscal 2015. The prior year reversal of $30.5 million of tax indemnification assets
resulted from our settlement with the IRS associated with a pre-acquisition Brooks Eckerd tax audit,
and was offset by an income tax benefit.
SG&A as a percentage of revenues was 25.7% in fiscal 2014 compared to 26.0% in fiscal 2013.
The decrease in SG&A as a percentage of revenues for fiscal 2014 was a result of leveraging the
increase in revenues and through various cost control initiatives. SG&A expenses decreased by
$39.6 million in fiscal 2014 compared to fiscal 2013 due primarily to a lower reversal of certain tax
indemnification assets, lower litigation costs and legal and professional fees, advertising, and
depreciation and amortization. These amounts are partially offset by increased salary and benefit costs
in fiscal 2014 as well as the $18.1 million favorable payment card interchange fee litigation settlement
in fiscal 2013. Both the fiscal 2014 and 2013 reversals of $30.5 million and $91.3 million, respectively, of
tax indemnification assets resulting from our settlement with the IRS associated with a pre-acquisition
Brooks Eckerd tax audit, are offset by an income tax benefit.
33