Rite Aid 2015 Annual Report Download - page 31
Download and view the complete annual report
Please find page 31 of the 2015 Rite Aid annual report below. You can navigate through the pages in the report by either clicking on the pages listed below, or by using the keyword search tool below to find specific information within the annual report.-
 1
1 -
2
-
3
-
4
-
5
-
6
-
7
-
8
-
9
-
10
-
11
-
12
-
13
-
14
-
15
-
16
-
17
-
18
-
19
-
20
-
 21
21 -
 22
22 -
 23
23 -
 24
24 -
 25
25 -
 26
26 -
 27
27 -
 28
28 -
 29
29 -
 30
30 -
 31
31 -
 32
32 -
 33
33 -
 34
34 -
 35
35 -
 36
36 -
 37
37 -
 38
38 -
 39
39 -
 40
40 -
 41
41 -
42
-
43
-
44
-
45
-
46
-
47
-
48
-
49
-
50
-
51
-
52
-
53
-
54
-
55
-
56
-
57
-
58
-
59
-
60
-
61
-
62
-
63
-
64
-
65
-
66
-
67
-
68
-
69
-
70
-
71
-
72
-
73
-
74
-
75
-
76
-
77
-
78
-
79
-
80
-
81
-
82
-
83
-
84
-
85
-
86
-
87
-
88
-
89
-
90
-
91
-
92
-
93
-
94
-
95
-
96
-
97
-
98
-
99
-
100
-
101
-
102
-
103
-
104
-
105
-
106
-
107
-
108
-
109
-
110
-
111
-
112
-
113
-
114
-
115
-
116
-
117
-
118
-
119
-
120
-
121
-
122
-
123
-
124
-
125
-
126
-
127
-
128
-
129
-
130
-
131
 |
 |

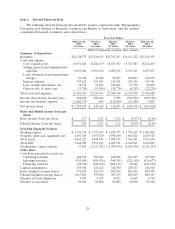
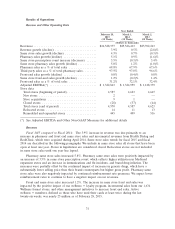
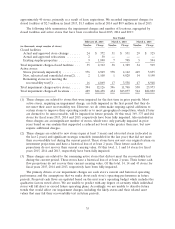
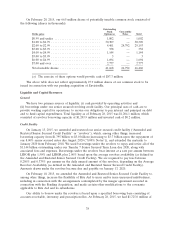
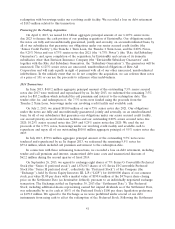
Results of Operations
Revenue and Other Operating Data
Year Ended
February 28, March 1, March 2,
2015 2014 2013
(52 Weeks) (52 Weeks) (52 Weeks)
(Dollars in thousands)
Revenues .................................... $26,528,377 $25,526,413 $25,392,263
Revenue growth (decline) ........................ 3.9% 0.5% (2.8)%
Same store sales growth (decline) .................. 4.3% 0.7% (0.3)%
Pharmacy sales growth (decline) ................... 5.1% 0.9% (1.6)%
Same store prescription count increase (decrease) ...... 3.5% (0.3)% 3.4%
Same store pharmacy sales growth (decline) ........... 5.8% 1.2% (1.0)%
Pharmacy sales as a % of total sales ................ 68.8% 67.9% 67.6%
Third party sales as a % of total pharmacy sales ........ 97.5% 97.0% 96.6%
Front-end sales growth (decline) ................... 0.8% (0.4)% 0.8%
Same store front-end sales growth (decline) ........... 1.2% (0.2)% 1.4%
Front-end sales as a % of total sales ................ 31.2% 32.1% 32.4%
Adjusted EBITDA(*) ........................... $ 1,322,843 $ 1,324,959 $ 1,128,379
Store data:
Total stores (beginning of period) ................. 4,587 4,623 4,667
New stores ................................. 2 — —
Store acquisitions ............................ 9 1 —
Closed stores ............................... (28) (37) (44)
Total stores (end of period) ..................... 4,570 4,587 4,623
Relocated stores ............................. 14 11 13
Remodeled and expanded stores ................. 445 409 516
(*) See Adjusted EBITDA and Other Non-GAAP Measures for additional details
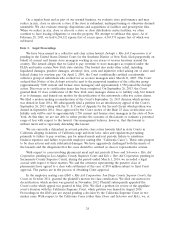
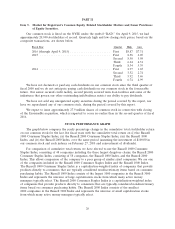
Revenues
Fiscal 2015 compared to Fiscal 2014: The 3.9% increase in revenue was due primarily to an
increase in pharmacy and front end same store sales and incremental revenues from Health Dialog and
RediClinic, which were acquired during April 2014. Same store sales trends for fiscal 2015 and fiscal
2014 are described in the following paragraphs. We include in same store sales all stores that have been
open at least one year. Stores in liquidation are considered closed. Relocation stores are not included
in same store sales until one year has lapsed.
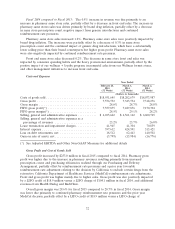
Pharmacy same store sales increased 5.8%. Pharmacy same store sales were positively impacted by
an increase of 3.5% in same store prescription count, which reflects higher utilization in Medicaid
expansion states and an increase in immunizations and flu incidents, and brand drug inflation. The
increases were partially offset by the continued impact of increases in generic drugs, which have a
substantially lower selling price than their brand counterparts but higher gross profit. Pharmacy same
store sales were also negatively impacted by continued reimbursement rate pressures. We expect lower
reimbursement rates to continue to have a negative impact on our revenues.
Front end same store sales increased 1.2%. The increase in same store front end sales was
impacted by the positive impact of our wellness + loyalty program, incremental sales from our 1,634
Wellness format stores, and other management initiatives to increase front end sales. Active
wellness + members, defined as those who have used their cards at least twice during the last
twenty-six weeks, was nearly 25 million as of February 28, 2015.
31