Rite Aid 2015 Annual Report Download - page 50
Download and view the complete annual report
Please find page 50 of the 2015 Rite Aid annual report below. You can navigate through the pages in the report by either clicking on the pages listed below, or by using the keyword search tool below to find specific information within the annual report.-
 1
1 -
2
-
3
-
4
-
5
-
6
-
7
-
8
-
9
-
10
-
11
-
12
-
13
-
14
-
15
-
16
-
17
-
18
-
19
-
20
-
21
-
22
-
23
-
24
-
25
-
26
-
27
-
28
-
29
-
30
-
31
-
32
-
33
-
34
-
35
-
36
-
37
-
38
-
39
-
 40
40 -
 41
41 -
 42
42 -
 43
43 -
 44
44 -
 45
45 -
 46
46 -
 47
47 -
 48
48 -
 49
49 -
 50
50 -
 51
51 -
 52
52 -
 53
53 -
 54
54 -
 55
55 -
 56
56 -
 57
57 -
 58
58 -
 59
59 -
 60
60 -
61
-
62
-
63
-
64
-
65
-
66
-
67
-
68
-
69
-
70
-
71
-
72
-
73
-
74
-
75
-
76
-
77
-
78
-
79
-
80
-
81
-
82
-
83
-
84
-
85
-
86
-
87
-
88
-
89
-
90
-
91
-
92
-
93
-
94
-
95
-
96
-
97
-
98
-
99
-
100
-
101
-
102
-
103
-
104
-
105
-
106
-
107
-
108
-
109
-
110
-
111
-
112
-
113
-
114
-
115
-
116
-
117
-
118
-
119
-
120
-
121
-
122
-
123
-
124
-
125
-
126
-
127
-
128
-
129
-
130
-
131
 |
 |

corresponding adjustments to tax indemnification asset), interest expense, depreciation and
amortization, LIFO adjustments, charges or credits for facility closing and impairment, inventory write-
downs related to store closings, debt retirements, and other items (including stock-based compensation
expense, sale of assets and investments, and revenue deferrals related to our customer loyalty program).
We reference this particular non-GAAP financial measure frequently in our decision-making because it
provides supplemental information that facilitates internal comparisons to the historical operating
performance of prior periods and external comparisons to competitors’ historical operating
performance. In addition, incentive compensation is based on Adjusted EBITDA and we base certain
of our forward-looking estimates on Adjusted EBITDA to facilitate quantification of planned business
activities and enhance subsequent follow-up with comparisons of actual to planned Adjusted EBITDA.
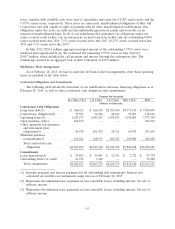
The following is a reconciliation of Adjusted EBITDA to our net income for fiscal 2015, 2014 and
2013:
February 28, March 1, March 2,
2015 2014 2013
(52 weeks) (52 weeks) (52 weeks)
Net income ...................................... $2,109,173 $ 249,414 $ 118,105
Interest expense ................................. 397,612 424,591 515,421
Income tax expense (benefit) ........................ 158,951 804 (110,600)
Income tax valuation allowance reduction ............... (1,841,304) — —
Depreciation and amortization expense ................ 416,628 403,741 414,111
LIFO (credit) charge .............................. (18,857) 104,142 (147,882)
Lease termination and impairment charges .............. 41,945 41,304 70,859
Other ......................................... 58,695 100,963 268,365
Adjusted EBITDA ................................. $1,322,843 $1,324,959 $1,128,379
In addition to Adjusted EBITDA, we occasionally refer to several other Non-GAAP measures, on
a less frequent basis, in order to describe certain components of our business and how we utilize them
to describe our results. These measures include but are not limited to Adjusted EBITDA Gross Margin
and Gross Profit (gross margin/gross profit excluding non-Adjusted EBITDA items), Adjusted EBITDA
SG&A (SG&A expenses excluding non-Adjusted EBITDA items), FIFO Gross Margin and FIFO Gross
Profit (gross margin/gross profit before LIFO charges), and Free Cash Flow (Adjusted EBITDA less
cash paid for interest, rent on closed stores, capital expenditures, acquisition costs and the change in
working capital).
We include these non-GAAP financial measures in our earnings announcements and guidance in
order to provide transparency to our investors and enable investors to better compare our operating
performance with the operating performance of our competitors including with those of our
competitors having different capital structures. Adjusted EBITDA or other non-GAAP measures should
not be considered in isolation from, and are not intended to represent an alternative measure of,
operating results or of cash flows from operating activities, as determined in accordance with GAAP.
Our definition of these non-GAAP measures may not be comparable to similarly titled measurements
reported by other companies.
50