Rite Aid 2010 Annual Report Download - page 93
Download and view the complete annual report
Please find page 93 of the 2010 Rite Aid annual report below. You can navigate through the pages in the report by either clicking on the pages listed below, or by using the keyword search tool below to find specific information within the annual report.-
 1
1 -
2
-
3
-
4
-
5
-
6
-
7
-
8
-
9
-
10
-
11
-
12
-
13
-
14
-
15
-
16
-
17
-
18
-
19
-
20
-
21
-
22
-
23
-
24
-
25
-
26
-
27
-
28
-
29
-
30
-
31
-
32
-
33
-
34
-
35
-
36
-
37
-
38
-
39
-
40
-
41
-
42
-
43
-
44
-
45
-
46
-
47
-
48
-
49
-
50
-
51
-
52
-
53
-
54
-
55
-
56
-
57
-
58
-
59
-
60
-
61
-
62
-
63
-
64
-
65
-
66
-
67
-
68
-
69
-
70
-
71
-
72
-
73
-
74
-
75
-
76
-
77
-
78
-
79
-
80
-
81
-
82
-
 83
83 -
 84
84 -
 85
85 -
 86
86 -
 87
87 -
 88
88 -
 89
89 -
 90
90 -
 91
91 -
 92
92 -
 93
93 -
 94
94 -
 95
95 -
 96
96 -
 97
97 -
 98
98 -
 99
99 -
 100
100 -
 101
101 -
 102
102 -
 103
103 -
104
-
105
-
106
-
107
-
108
-
109
-
110
-
111
-
112
 |
 |

RITE AID CORPORATION AND SUBSIDIARIES
NOTES TO CONSOLIDATED FINANCIAL STATEMENTS (Continued)
For the Years Ended February 27, 2010, February 28, 2009 and March 1, 2008
(In thousands, except per share amounts)
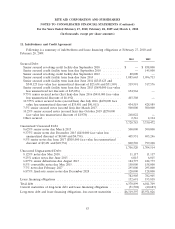
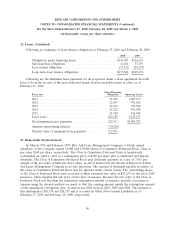
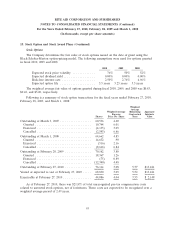
15. Stock Option and Stock Award Plans (Continued)
Stock Options
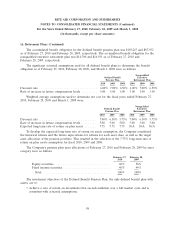
The Company determines the fair value of stock options issued on the date of grant using the
Black-Scholes-Merton option-pricing model. The following assumptions were used for options granted
in fiscal 2010, 2009 and 2008:
2010 2009 2008
Expected stock price volatility ............. 76% 50% 52%
Expected dividend yield .................. 0.00% 0.00% 0.00%
Risk-free interest rate ................... 2.50% 2.76% 4.96%
Expected option life .................... 5.5 years 5.25 years 5.5 years
The weighted average fair value of options granted during fiscal 2010, 2009, and 2008 was $0.83,
$0.42, and $3.20, respectively.
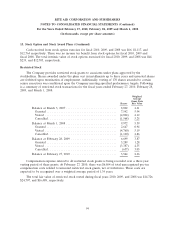
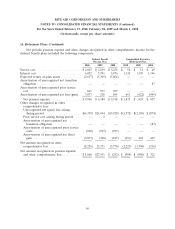
Following is a summary of stock option transactions for the fiscal years ended February 27, 2010,
February 28, 2009, and March 1, 2008:
Weighted
Average
Weighted Average Remaining Aggregate
Exercise Contractual Intrinsic
Shares Price Per Share Term Value
Outstanding at March 3, 2007 .................. 60,596 4.60
Granted ................................ 10,744 6.01
Exercised ............................... (4,135) 3.09
Cancelled ............................... (2,543) 6.66
Outstanding at March 1, 2008 .................. 64,662 4.85
Granted ................................ 14,632 .90
Exercised ............................... (516) 2.16
Cancelled ............................... (8,616) 6.84
Outstanding at February 28, 2009 ............... 70,162 3.80
Granted ................................ 18,367 1.26
Exercised ............................... (75) 0.89
Cancelled ............................... (12,340) 4.48
Outstanding at February 27, 2010 ............... 76,114 3.08 5.77 $13,181
Vested or expected to vest at February 27, 2010 ..... 68,890 3.09 5.52 $13,181
Exercisable at February 27, 2010 ................ 44,086 4.04 3.55 $ 2,148
As of February 27, 2010, there was $21,871 of total unrecognized pre-tax compensation costs
related to unvested stock options, net of forfeitures. These costs are expected to be recognized over a
weighted average period of 2.49 years.
93