Rite Aid 2010 Annual Report Download - page 74
Download and view the complete annual report
Please find page 74 of the 2010 Rite Aid annual report below. You can navigate through the pages in the report by either clicking on the pages listed below, or by using the keyword search tool below to find specific information within the annual report.-
 1
1 -
2
-
3
-
4
-
5
-
6
-
7
-
8
-
9
-
10
-
11
-
12
-
13
-
14
-
15
-
16
-
17
-
18
-
19
-
20
-
21
-
22
-
23
-
24
-
25
-
26
-
27
-
28
-
29
-
30
-
31
-
32
-
33
-
34
-
35
-
36
-
37
-
38
-
39
-
40
-
41
-
42
-
43
-
44
-
45
-
46
-
47
-
48
-
49
-
50
-
51
-
52
-
53
-
54
-
55
-
56
-
57
-
58
-
59
-
60
-
61
-
62
-
63
-
 64
64 -
 65
65 -
 66
66 -
 67
67 -
 68
68 -
 69
69 -
 70
70 -
 71
71 -
 72
72 -
 73
73 -
 74
74 -
 75
75 -
 76
76 -
 77
77 -
 78
78 -
 79
79 -
 80
80 -
 81
81 -
 82
82 -
 83
83 -
 84
84 -
85
-
86
-
87
-
88
-
89
-
90
-
91
-
92
-
93
-
94
-
95
-
96
-
97
-
98
-
99
-
100
-
101
-
102
-
103
-
104
-
105
-
106
-
107
-
108
-
109
-
110
-
111
-
112
 |
 |

RITE AID CORPORATION AND SUBSIDIARIES
NOTES TO CONSOLIDATED FINANCIAL STATEMENTS (Continued)
For the Years Ended February 27, 2010, February 28, 2009 and March 1, 2008
(In thousands, except per share amounts)
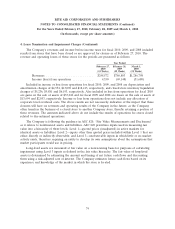
4. Lease Termination and Impairment Charges (Continued)
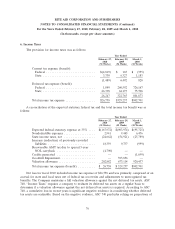
The Company’s revenues and income before income taxes for fiscal 2010, 2009, and 2008 included
results from stores that have been closed or are approved for closure as of February 27, 2010. The
revenue and operating losses of these stores for the periods are presented as follows:
Year Ended
February 27, February 28, March 1,
2010 2009 2008
(52 Weeks) (52 Weeks) (52 Weeks)
Revenues ........................... $248,572 $786,883 $1,286,798
Income (loss) from operations ............ 4,350 (69,148) (31,680)
Included in income or loss from operations for fiscal 2010, 2009, and 2008 are depreciation and
amortization charges of $4,554, $13,090 and $18,413, respectively, and closed store inventory liquidation
charges of $5,236, $9,881 and $6,193, respectively. Also included in loss from operations for fiscal 2010
are gains on the sale of assets of $33,042 and for fiscal 2009 and 2008 are losses on the sale of assets of
$13,694 and $2,853, respectively. Income or loss from operations does not include any allocation of
corporate level overhead costs. The above results are not necessarily indicative of the impact that these
closures will have on revenues and operating results of the Company in the future, as the Company
often transfers the business of a closed store to another Company store, thereby retaining a portion of
these revenues. The amounts indicated above do not include the results of operations for stores closed
related to discontinued operations.
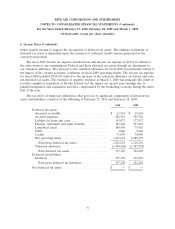
The Company is following the guidance in ASC 820, ‘‘Fair Value Measurements and Disclosures’’
as it relates to nonfinancial assets and liabilities. ASC 820 prioritizes inputs used in measuring fair
value into a hierarchy of three levels: Level 1—quoted prices (unadjusted) in active markets for
identical assets or liabilities; Level 2—inputs other than quoted prices included within Level 1 that are
either directly or indirectly observable; and Level 3—unobservable inputs in which little or no market
activity exists, therefore requiring an entity to develop its own assumptions about the assumptions that
market participants would use in pricing.
Long-lived assets are measured at fair value on a nonrecurring basis for purposes of calculating
impairment using Level 3 inputs as defined in the fair value hierarchy. The fair value of long-lived
assets is determined by estimating the amount and timing of net future cash flows and discounting
them using a risk-adjusted rate of interest. The Company estimates future cash flows based on its
experience and knowledge of the market in which the store is located.
74