Porsche 2012 Annual Report Download - page 217
Download and view the complete annual report
Please find page 217 of the 2012 Porsche annual report below. You can navigate through the pages in the report by either clicking on the pages listed below, or by using the keyword search tool below to find specific information within the annual report.-
 1
1 -
2
-
3
-
4
-
5
-
6
-
7
-
8
-
9
-
10
-
11
-
12
-
13
-
14
-
15
-
16
-
17
-
18
-
19
-
20
-
21
-
22
-
23
-
24
-
25
-
26
-
27
-
28
-
29
-
30
-
31
-
32
-
33
-
34
-
35
-
36
-
37
-
38
-
39
-
40
-
41
-
42
-
43
-
44
-
45
-
46
-
47
-
48
-
49
-
50
-
51
-
52
-
53
-
54
-
55
-
56
-
57
-
58
-
59
-
60
-
61
-
62
-
63
-
64
-
65
-
66
-
67
-
68
-
69
-
70
-
71
-
72
-
73
-
74
-
75
-
76
-
77
-
78
-
79
-
80
-
81
-
82
-
83
-
84
-
85
-
86
-
87
-
88
-
89
-
90
-
91
-
92
-
93
-
94
-
95
-
96
-
97
-
98
-
99
-
100
-
101
-
102
-
103
-
104
-
105
-
106
-
107
-
108
-
109
-
110
-
111
-
112
-
113
-
114
-
115
-
116
-
117
-
118
-
119
-
120
-
121
-
122
-
123
-
124
-
125
-
126
-
127
-
128
-
129
-
130
-
131
-
132
-
133
-
134
-
135
-
136
-
137
-
138
-
139
-
140
-
141
-
142
-
143
-
144
-
145
-
146
-
147
-
148
-
149
-
150
-
151
-
152
-
153
-
154
-
155
-
156
-
157
-
158
-
159
-
160
-
161
-
162
-
163
-
164
-
165
-
166
-
167
-
168
-
169
-
170
-
171
-
172
-
173
-
174
-
175
-
176
-
177
-
178
-
179
-
180
-
181
-
182
-
183
-
184
-
185
-
186
-
187
-
188
-
189
-
190
-
191
-
192
-
193
-
194
-
195
-
196
-
197
-
198
-
199
-
200
-
201
-
202
-
203
-
204
-
205
-
206
-
 207
207 -
 208
208 -
 209
209 -
 210
210 -
 211
211 -
 212
212 -
 213
213 -
 214
214 -
 215
215 -
 216
216 -
 217
217 -
 218
218 -
 219
219 -
 220
220 -
 221
221 -
 222
222 -
 223
223 -
 224
224 -
 225
225 -
 226
226 -
 227
227 -
228
-
229
-
230
-
231
-
232
-
233
-
234
-
235
-
236
-
237
-
238
-
239
-
240
-
241
-
242
-
243
-
244
-
245
-
246
-
247
-
248
-
249
-
250
-
251
-
252
-
253
-
254
-
255
-
256
-
257
-
258
-
259
-
260
-
261
-
262
-
263
-
264
-
265
-
266
-
267
-
268
-
269
-
270
 |
 |
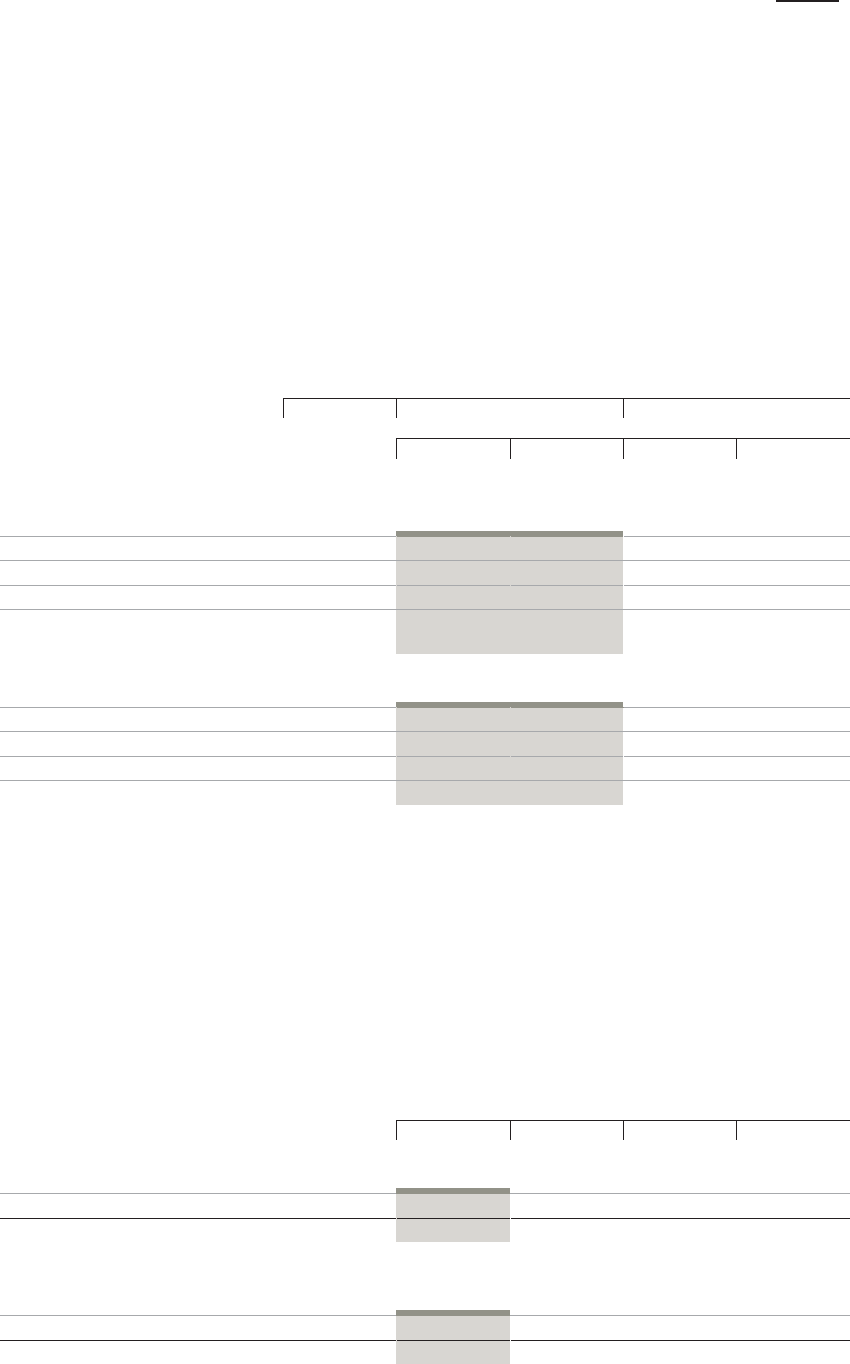
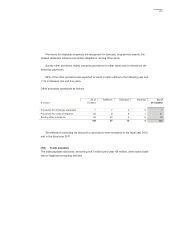
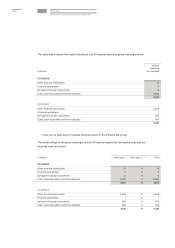
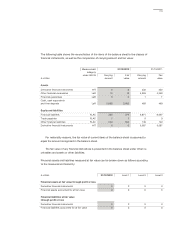
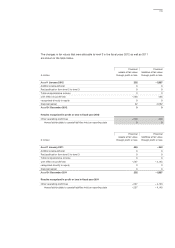
The following table shows the reconciliation of the items of the balance sheet to the classes of
financial instruments, as well as the comparison of carrying amount and fair value:
For materiality reasons, the fair value of current items of the balance sheet is assumed to
equal the amount recognized in the balance sheet.
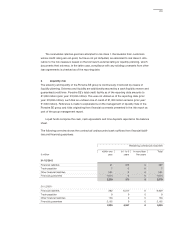
The fair value of any financial derivatives is presented in the balance sheet under other re-
ceivables and assets or other liabilities.
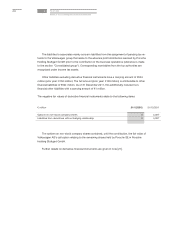
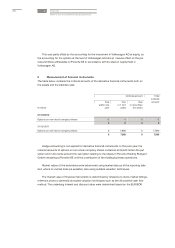
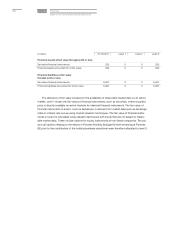
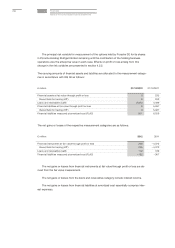
Financial assets and liabilities measured at fair value can be broken down as follows according
to the measurement hierarchy:
Measurement 31/12/2012 31/12/2011
category
under IAS 39 Carrying Fair Carrying Fair
€ million amount value amount value
Assets
Derivative financial instruments HfT 0 0 232 232
Other financial receivables LaR 10 10 4,029 4,249
Financial guarantees LaR 0 0 1 1
Cash, cash equivalents
and time deposits LaR 2,862 2,862 469 469
Equity and liabilities
Financial liabilities FLAC 300 374 5,871 6,097
Trade payables FLAC 7 7 9 9
Other financial liabilities FLAC 504 504 149 149
Derivative financial instruments HfT 0 0 5,087 5,087
€ million 31/12/2012 Level 1 Level 2 Level 3
Financial assets at fair value through profit or loss
Derivative financial instruments 0 0 0 0
Financial assets accounted for at fair value 0 0 0 0
Financial liabilities at fair value
through profit or loss
Derivative financial instruments 0 0 0 0
Financial liabilities accounted for at fair value 0 0 0 0
213